When you look at a chart, whether it’s the forex market, the stocks, or crypt currencies, you will either see it moving up, down or both up and down. That’s all it does. But there are two forces that work the price that makes it go up or down. The two forces are always at work. I’d like to shed some light here on the Two Forces that shape the market. This concept will definitely improve your forex trading.
The force that makes it move more in one direction relative to the other is called the Momentum.
The force that acts against the buying or selling pressure, kills the momentum and brings price back to the mean. This is the concept of Reversion to Mean.
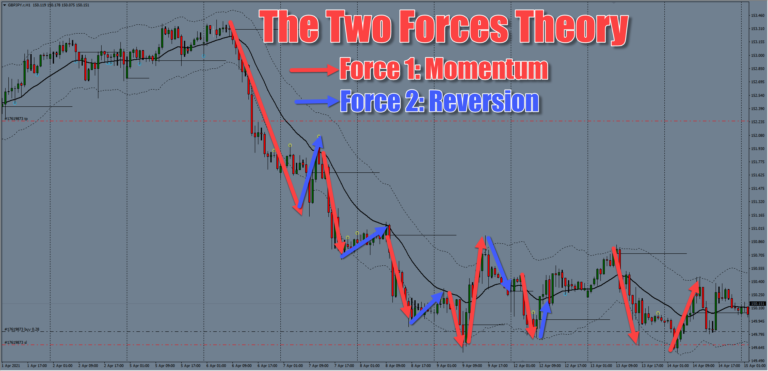
In the following chart of GBP/JPY I have marked the moments of momentum and reversion to mean with arrows. See if you can spot momentum and reversion phases. The pound yen is a great currency and almost all traders look at it while forex trading or not.

There is a point in trend when price reverts back to the mean. That is your point of entry. These spots will allow you to get the best entries with the lowest risk and highest reward possibility.
There is one force that takes the market in one direction, it’s the momentum forces and the second force is Reversion to Mean. This is the law of the universe. What comes up, must come down. It does not matter if you look at a forex chart or a stock chart. Whenever you see a chart for trading, you will see these two forces at work underneath the surface.
The chart above has Red arrows showing momentum and blue arrows showing reversion to mean.
Near the reversion to the Mean you want to use some kind of entry method.
Entry Methods for Forex and Stocks Trading
1. Just make limit orders near 20ema / mid line of Keltner Channels or
2. Use confirmation such as AIMS The Seed Signal or Reversal candles such as Ooutside BNars or Pin bars which can be printed using AIMS The Cherry signal indicator. The Cherry which covers both OB and PB candle formations.
AIMS THE Hunt 2.0 – The Cherry signal is a great entry method.
The picture below shows how to trade The Cherry Signal. The cherry is a great entry indicator that can be use for forex, stocks or cryptos.

I hope this helps you understand how to trade pull backs. You can apply the concept to Forex and Stocks Markets. If you’d like to use confirmation method that has been tried and tested and has excellent algorithm behind it then look no further. AIMS The Cherry Indicator does an excellent job.
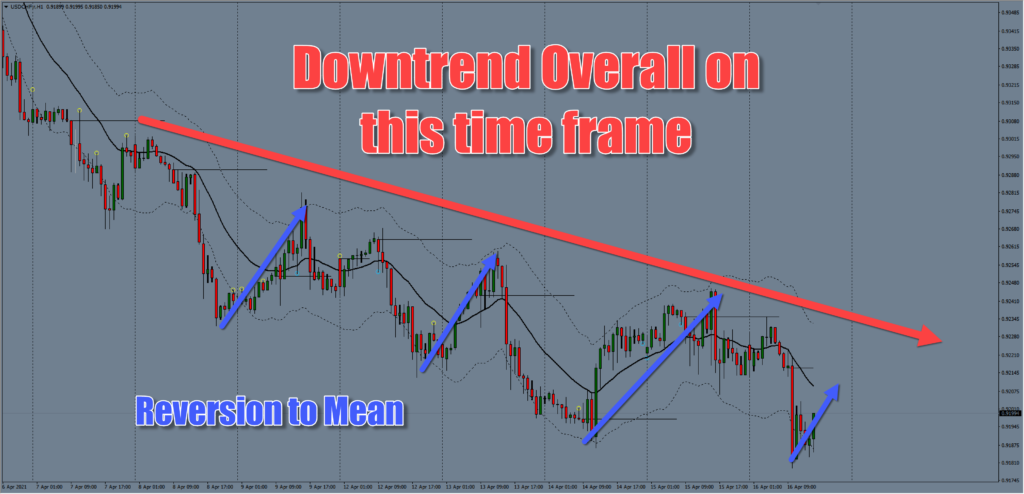
The following chart of USD/CHF The Swissy shows that it is in an overall downtrend but within the trend down, it has been pulling back up. Those are a reversion to mean moves.
1 thought on “The Two Forces Theory | Forex and Stocks Trading Concept”
Hey, if you wanted to ask questions, you can always simply comment here in this space. Available for all posts and pages.