Download FREE Guide 10s Elliott Wave (Value $197 )

After Reading this material you should be able to do the following:
- Objective 1. Understand Elliott Wave
- Objective 2. Count Elliott Wave within 10 Sec
- Objective 3. Learn how to use AO
Objective 1
What is Elliott Wave?
We believe the market has a structure. That structure is Elliott Wave.
Which wave is most profitable and easy to trade?
Wave 3 is where we make money. Our strategy puts us right into the impulse waves, where the money is made.
Hypothetically, this is how Elliott Wave looks like.

Within each Impulse wave there are 5 waves. of which wave 1,3,5, are again impulse waves whereas wave 2 and 4 are corrective waves.
An impulse wave consists of sequence of 5 waves starting from 1 up 2 down 3 up and 4 down and 5 up again. This is then followed by smaller waves a,b and c. This is then followed by a new 1-2 and 3 and 4 followed by 5. and goes on….
This is where AIMS/Fractals come in and this is where the concept of Fractal Geometry enters the scene.
Fractal geometry simple means that we live in a universe where things have a certain specific structure and the parts have the same structure as the whole. It keeps repeating itself e.g. Waves within waves within waves.
Please watch this video.
Just like the Mandelbrot Set above, the Fractal Geometry of Elliott Waves works in the same manner.
If you strart off a monthly chart and work your wave down to one minute chart you will see that the Elliott Wave sequence repeats itself over and over.
Moreover, we have limited time frames available on mt4 otherwise we could be much more clear about waves. We need a platform that zooms in and out using seconds or minutes rather than set time frames. I wish one day I might get one like that.


The following charts and text shows how to count the waves using AO within 10 seconds.
Remember we do not trade Elliott Wave, its an Ungrounded assessment, its an opinion its there to give us confidence. Instead we take trades based on our system generated Entry and Exit Signals. We use EW for confidence and fun.
What are Grounded Assessments?
Indicator 1. AIMS AO
Indicator 2. Alligator
Indicator 3. AIMS Levels
To make our job easier we have 2 simple Entry Setups with clear and easy rules. So entries and exit according to rules only.
To make our job even easier we have a talking alert with Human Voice Interface. Click Here
Objective 2 and 3
How to use AIMS AO to count waves within 10 Seconds?
so
Each trend begin with wave 1 and 2. They are quite small as compared to its 3rd wave. infact in a sequence of 5 waves 1-2 could be the smallest. But dont bet on it, chaos is unpredictable yet stable and highly organised.
In my experience 8 out 10 time we find the best 1-2 waves when AO is close to ZL. Setup 1 is the answer.
1-2 also occurs sometimes at the peak of AO but that is reversal technique an its not discussed here so far. But we do it in a different fashion. Which I shall discuss some other day.
Then comes the third wave, this is the biggest prettiest wave. We want to be in it when it happens. The way to be in it is to watch the market when 1-2 occurs. The way to catch 1-2 is to catch AO when its at Zero Line.
3 is the strongest move after which comes the ugliest wave 4. We dont want to be in this and we use AO to help us here again. Then comes the 5th wave. Its usually is relatively smaller in length then its respective 3rd wave. There is a way to find out in advance where the 5th might end. I’ll discuss later. Getting into 5th wave could be tricky. Hence we use lower M1 to enter 5th wave of M5. We simply look for a setup to occur on m1 in the direction of m5. more on this later… but first EW!!!
Wave 1-2 usually Occur around and near Zero Line
How to make money using this information?
The answer is follow Setup 1. for Details of Setup 1 How to Trade AIMS
When Alligator is asleep and AO is close to Zero Line, i.e. Setup 1 as per our rules, we increase our chances to hit the 3rd wave.
Wave 3 – Peak of AO Identifies 3rd Wave
How to make money using this information?
We know that when AO peaks we might be seeing the end of Wave 3. Now Wave 3 is our primary objective and if we have successfully take Setup one, into the third wave, AO would now help us time exiting with profit.
How to use AO?
AO is momentum indicator and hence if it peaks properly and starts to show signs of weakness of momentum we start thinking about bring our Stop Loss closer and perhaps might consider exiting on close on green line and/or break of AIMS Level in the opposite direction of our trade, which ever is closer.
Please go to How to Trade AIMS to understand how to read AO.

Wave 4 – After 3rd wave i.e. peak of AO is identified, AO crosses ZL and changes colour, that is minimum requirement of 4th wave.
How to avoid losing money using this information?
If we traded the third wave and now are out of the market, we would happily wait and do not trade until AO cross ZL in the opposite direction or at least travel back closer to its ZL.
Three things might happen while AO starts its journey back to ZL.
a. Price goes up and down in a crazy fashion and may confuse bars on AO but still remain range bound but rather taller AIMS are created. In this case AO takes a bit longer to get to ZL.
b. price remains range bound within tight aims level and goes sideways, AO goes back to ZL easily and we are read to trade again, of course without doubt if the rules are there.
c. Price might reverse in this case quikly forming a 1-2 formation at the top/peak of AO and starts reversing. in this case by the time we get to the first bar of AO situation, that is crossing of ZL we are too late to make entries. Checking the 3 rules will help greatly here. Hene we do not trade the crossing of AO in the opposite direction of a peak of AO. That is because 1. It could be the 4th wave, (crossing of ZL of AO being minimum requirement for assuming we are in wave 4) and 2. by the time AO crosses ZL the reversal had already begun at the peak of AO and we are too late. We wait for next setup.
So what we need to do is to use AO in this fashion in order to avoid Wave 4 and its profit destroying whipsaws. Though I beat the drum about this I find myself quite often giving back my profit during this wave. As soon as I’m “conciously aware of it” I stop and calm myself down. Take some deep breaths. 🙂
If we could avoid wave 4’s successfully we shall never lose money even if we are not making alot of money. I can almost guarantee that. In fact the defining point between a money making trader and otherwise is this. The ability to avoid wave 4s. And its simple. Dont trade after peak of AO. Wait for it to come back to ZL. Check the Rules. Don’t trading without checking rules.
Please read this page for How to avoid the chops/Wave 4 and Strategy in a Nutshell
Wave 5. After 4th wave AO crosses ZL again in the direction of the previous peak of AO which signified a possible 3rd wave and peaks again but this time it Diverges. This divergence is our clue that we might be in wave 5.
What is Divergence? Click Here Again Babypips does a fine job here. I love this site.
How to make more money again using this information?
Getting into a Wave 5 could be tricky. This is because it comes out of a Wave 4. The assassin wave for all the traders in the world. LOL!
As discussed above if price moves in a relatively calm manner, does not create very tall AIMS Levels and gives us either of the 2 setups, we take trade in the direction of the previous third wave in case of setup 2 or bracket the market in case of setup 1.
Note that even if we think wave 3 has occcured we would still take setup against wave 3 if the rules on the setup apply. This means,
We trade our Entry Setup 1 and 2. But it does serve as a pathway that keeps us motivated and brings some fun. It gives us confidence to take a trade an certainly, anything, any tool that would help confidence is honesty welcome.
The experience of unfolding of ones predictions and the count as we expected is a tasty pie to have!
Here is a little trick on how to get into wave 5 easily.
Once you have found peak of AO on m5 chart. and would like to make entry into 5th wave (ungrounded assessment) we would use m1 chart.
Use m1 chart to count a,b,c. After a Green Peak of AO on M5 ,
you’ll see an A down then B up followed by C down. During this period AO on M5 will either turn red or come close to ZL. Now wait for setup to appear on M1 or M5. Which ever comes first take it.
Find Target Zone of Wave 5?
8 out of 10 times Wave 5, ends between Fib Expansion 62 and 100. We call this the Target Zone 1 and Target Zone 2.
Fibonacci Expansion Tool
This is standard MT4 study that comes free of cost.
We plot between FE 62 and 100. We can start looking for exit signals when price enters this zone.
One can also set Target Point at either 62 or 100 or somewhere in between.
Examples
Following is an example of Counting Elliott Wave within 10 Seconds and the 5th wave Target Zones, followed by more examples from live charts.
Example 1.
Example 2. GU M5 Chart
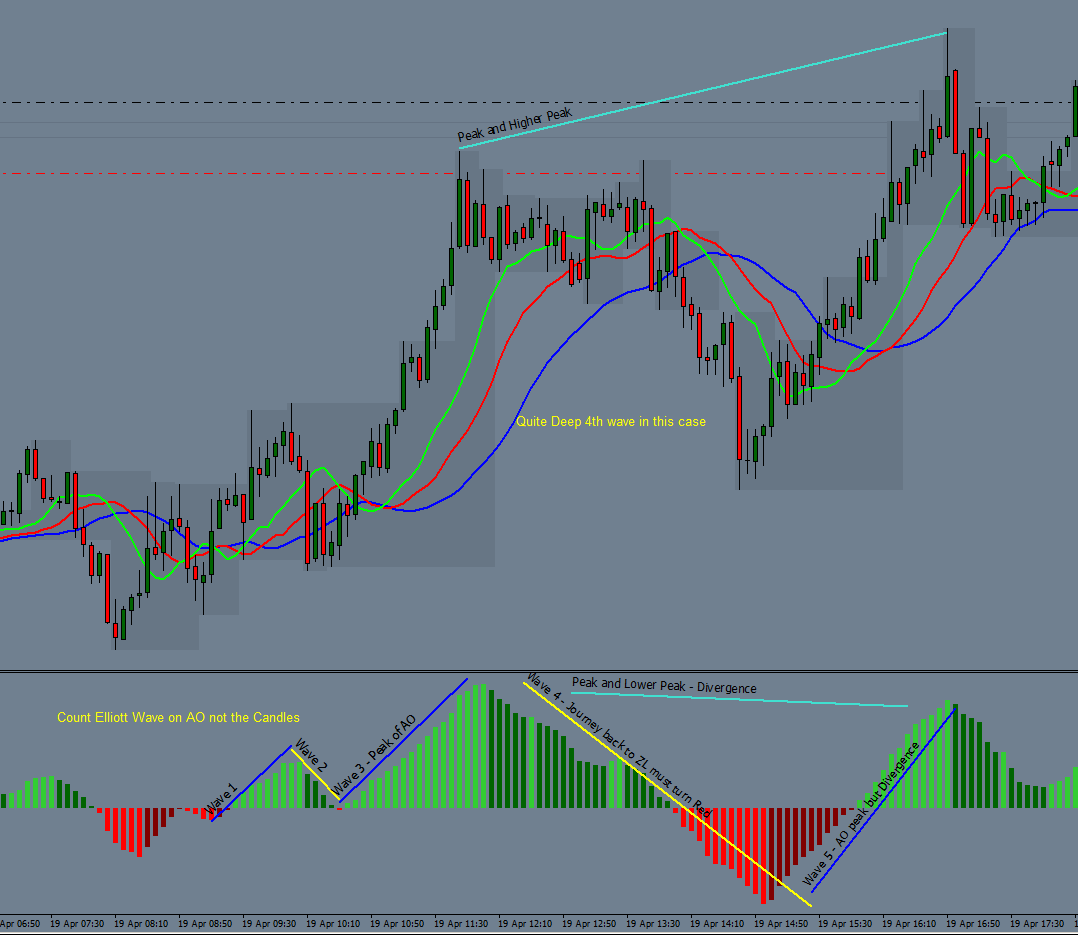 |
| Note that the 4th wave went quite deep and was even tradable. AO peaked nicly on the other side yet when it reversed we found a fifth wave divergence (green) and completed the wave sequence. |
Example 3.
 |
| Note that Wave started off a peak of AO on the other side, hence difficult to catch on current time frame. |
Example4
 |
| Note that Alligator turned around quickly and 1-2 were formed after cross of AO, also note that AO diverges before it crosses ZL that shows the 5th of the 3rd wave and then it goes to ZL briefly crosses ZL and comes back up and creates a new peak but the peak is lower than the previous peak |
Example 5 – In the following chart you’d be able to pick 3 4 and 5 within 10 seconds. give it a shot!!!
The blog is full of examples on how to count waves within 10 seconds. Have Fun!