The 3 Secret Forex Trading Rules for Beginners
In this 3 part lesson you will learn about the 3 most important forex trading rules. These 3 rules will allow you to validate an entry setup. These Forex trading entry setup rules are objective and easy to understand. When the three rules are checked, the setup is valid. These forex trading rules will keep you out of trouble on most days.
Part 1 of 3
Note 1: I have chosen to hide black dots in the settings in this video so you won’t see the black dots. Black dots actually mean price closed inside the gator mouth a. below the green line which Purple is below the green or b. price closed above the green line while green was below the purple line.
Note 2: The v5.1 indicator checks for purple line, encoded, so that question is nearly always answered but it’s good to learn and make this a practice. These forex questions ensure you follow the 3 secret forex trading rules.
Part 2 of 3
Special Thanks to Grant Hardiman who originally came up with the idea and created the flow chart! Thank You for this Great Flow Chart! It makes our life a lot easier.
Part 3 of 3
Additional Information about Higher Probability Setups
These three rules create what we call the Setup pattern. The setup pattern is created with the help of our 3 AIMS Indicators. Each Indicator has its relative rule attached to it. Together they bring to life a pattern that is going to change the way you trade and perhaps live forever.
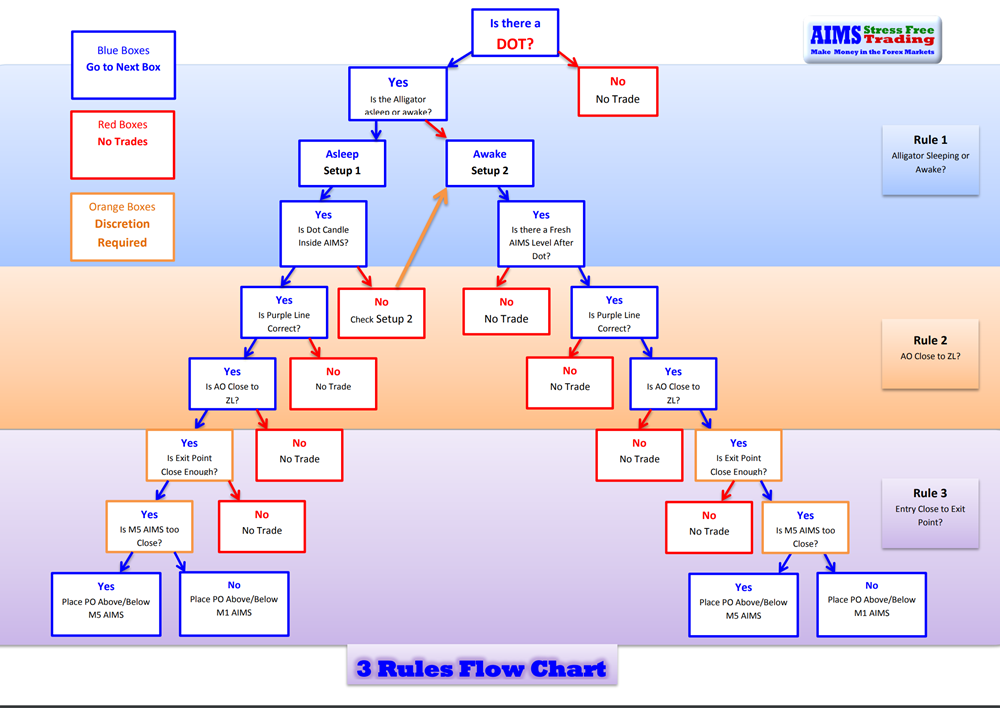
We Need to be objective yet keep the process simple and understandable. The Flow chart breaks down the Setup entry signal into various understandable steps.
Let’s make our trading analysis objective and very simple. By following the flowchart, you’ll make sure that every trade you take is based on a simple but very objective and logical analysis.
In doing so, At the end of the day, you are able to tell whether you have followed the rules or not.
Always Keep it Handy, especially during your T20 Discipline Training Phase. Stage 1-2 Rely on this heavily
What is The Setup 1 Pattern
Before you take a Setup 1 or Setup 2 Entry Signal, You First Have to Create The Setup Pattern.
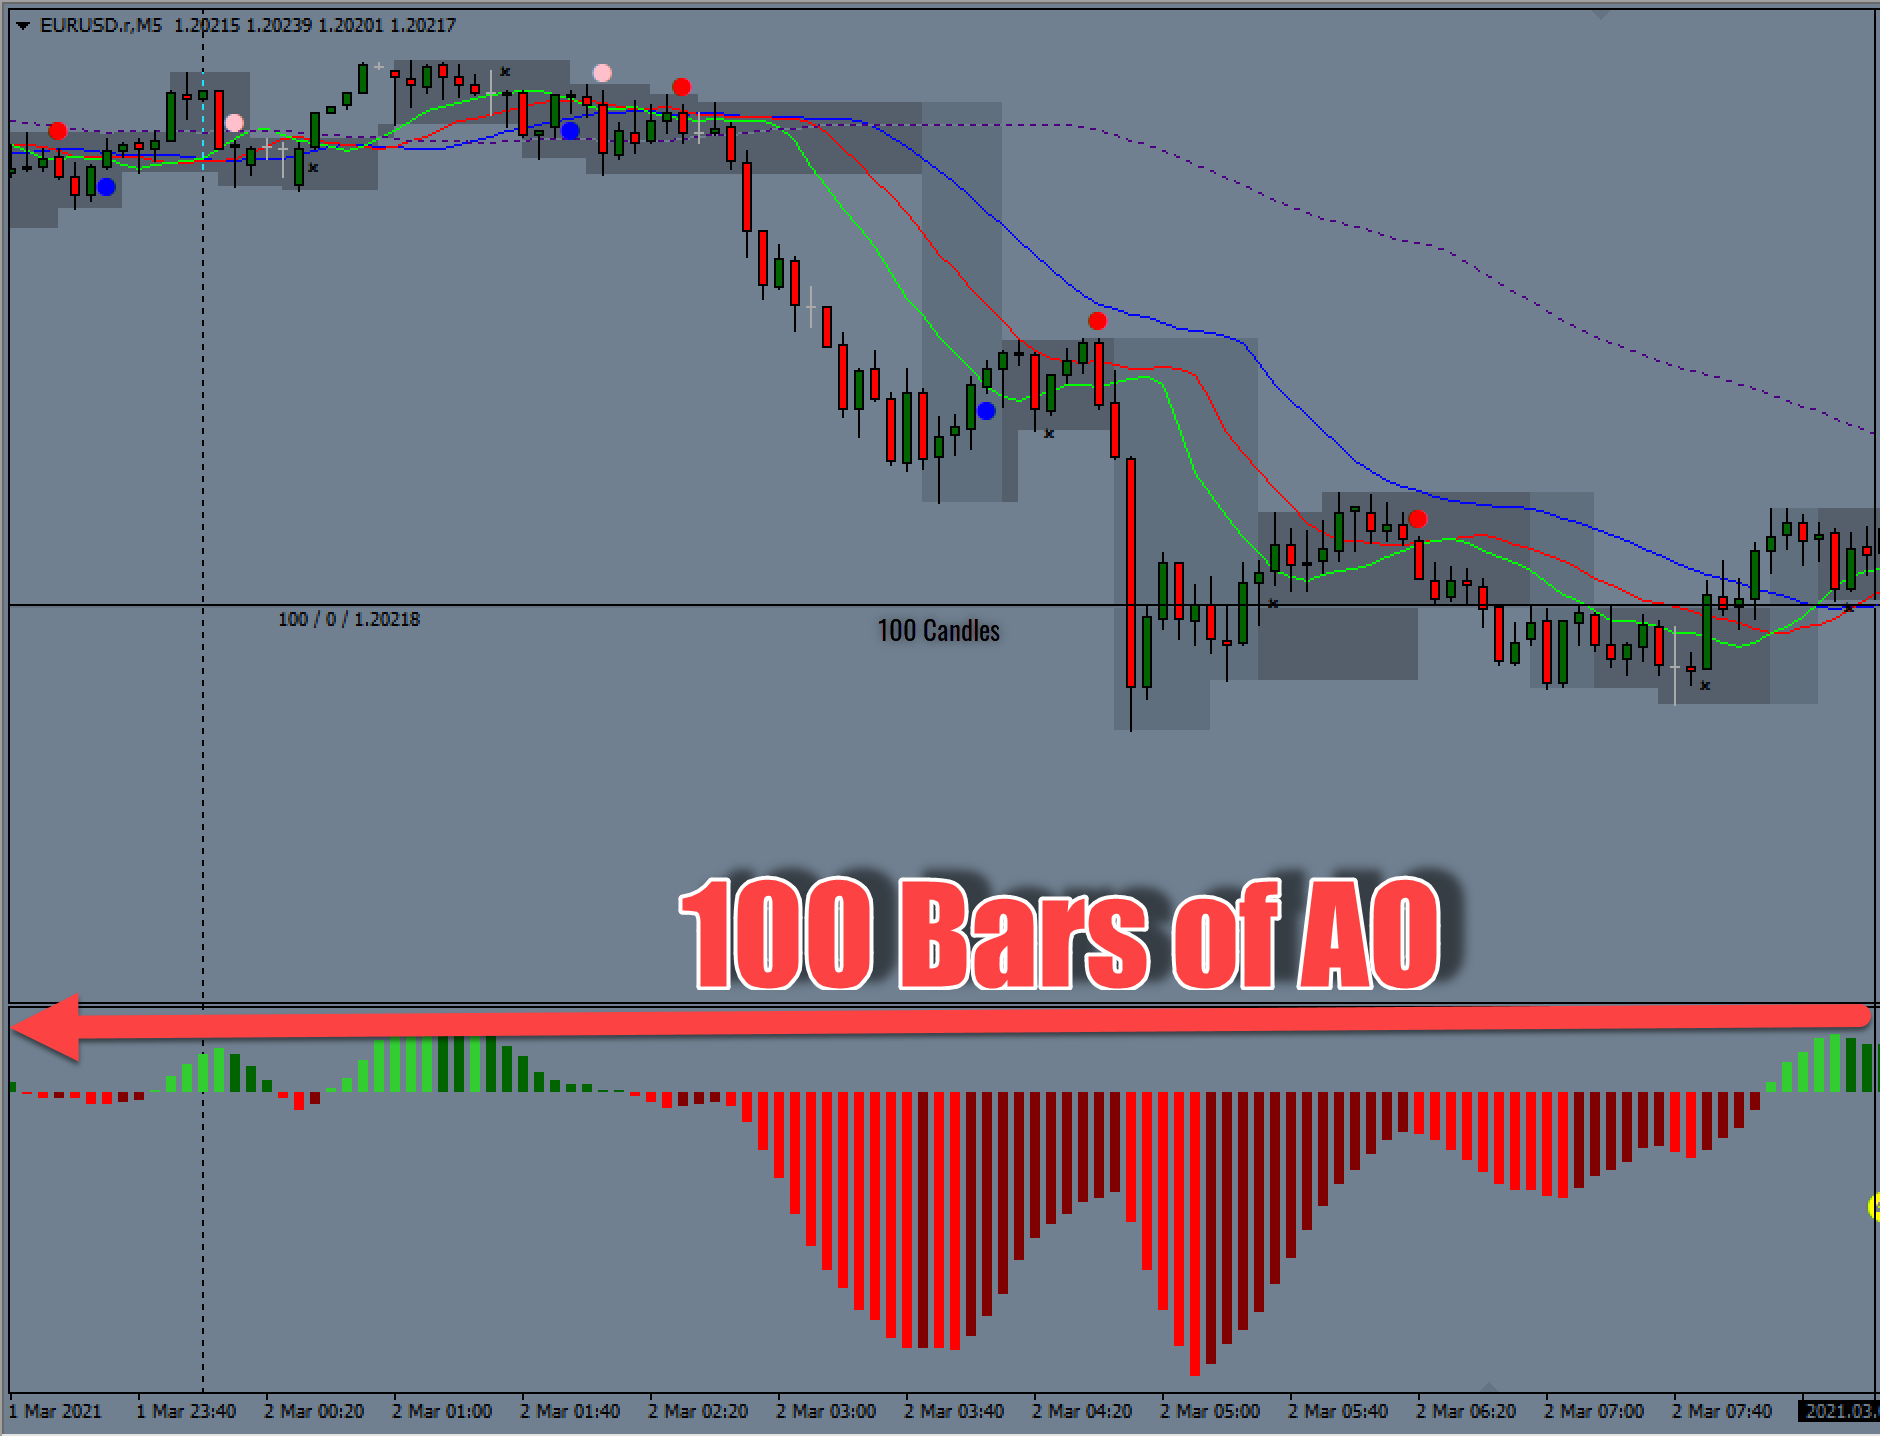
The Setup Pattern is Created by analyzing the Last 60-100 Bars of AIMS Wave and price candles. Basically what you see on a full-screen chart consisting of at least 100 candles/bars.
First You Look for a Major Peak on either side of the AIMS Wave histogram within the last 100 Candles and Bars of the AIMS Wave.

This means you’ve noticed a Peak of AO/ AIMS WAve and You’ve spotted an open gator and price going in that direction.
If the Colour is Green and that is the largest Peak, then that is probably your trend. More on this in How to Count Elliott Waves within 10 Seconds Tutorial Here
Note that The Setup Pattern and The Setup One Signal are Two Different but Related things. More on this in this Video Here: The Perfect Setup. But before you jump consider watching the following 3 part video series.
The 3 Secret Rules to Create The Perfect Setup
[ Video Tutorial Course]
In this video, Immy goes through The Three Rules Flow Chart for Taking and filtering Setup 1 and Setup 2 Using hourly charts on currency pairs
The following is a screenshot of the Flowchart. This is just a thumbnail version. Download PDF Download version to get Higher Resolution Print Out.

Here is a PDF File of the Flowchart: Please Download – Print (Laminate if possible) and Display next to your Trading PC.
One Extra Question to Ask during and after this Flow Chart Analysis:
What is the eWave analysis on both the Current Time Frame and 5X Higher Time Frame?
This Final question will keep you in tune with the market and help to boost confidence or filter some setups. Use it wisely.
