There are just a few main patterns of the market cycle. We see the market as charts and the chart is made of candles and bars. That’s how we see the market, a chart. One of the component of the Market Cycle is a particular candle pattern.
A trend candle is a candle pattern that indicates strength or weakness in the market. It is a candle that appears within trends or trading ranges. A trend candle can be used in various ways but its meanings change based on its position within trend or a trading range.
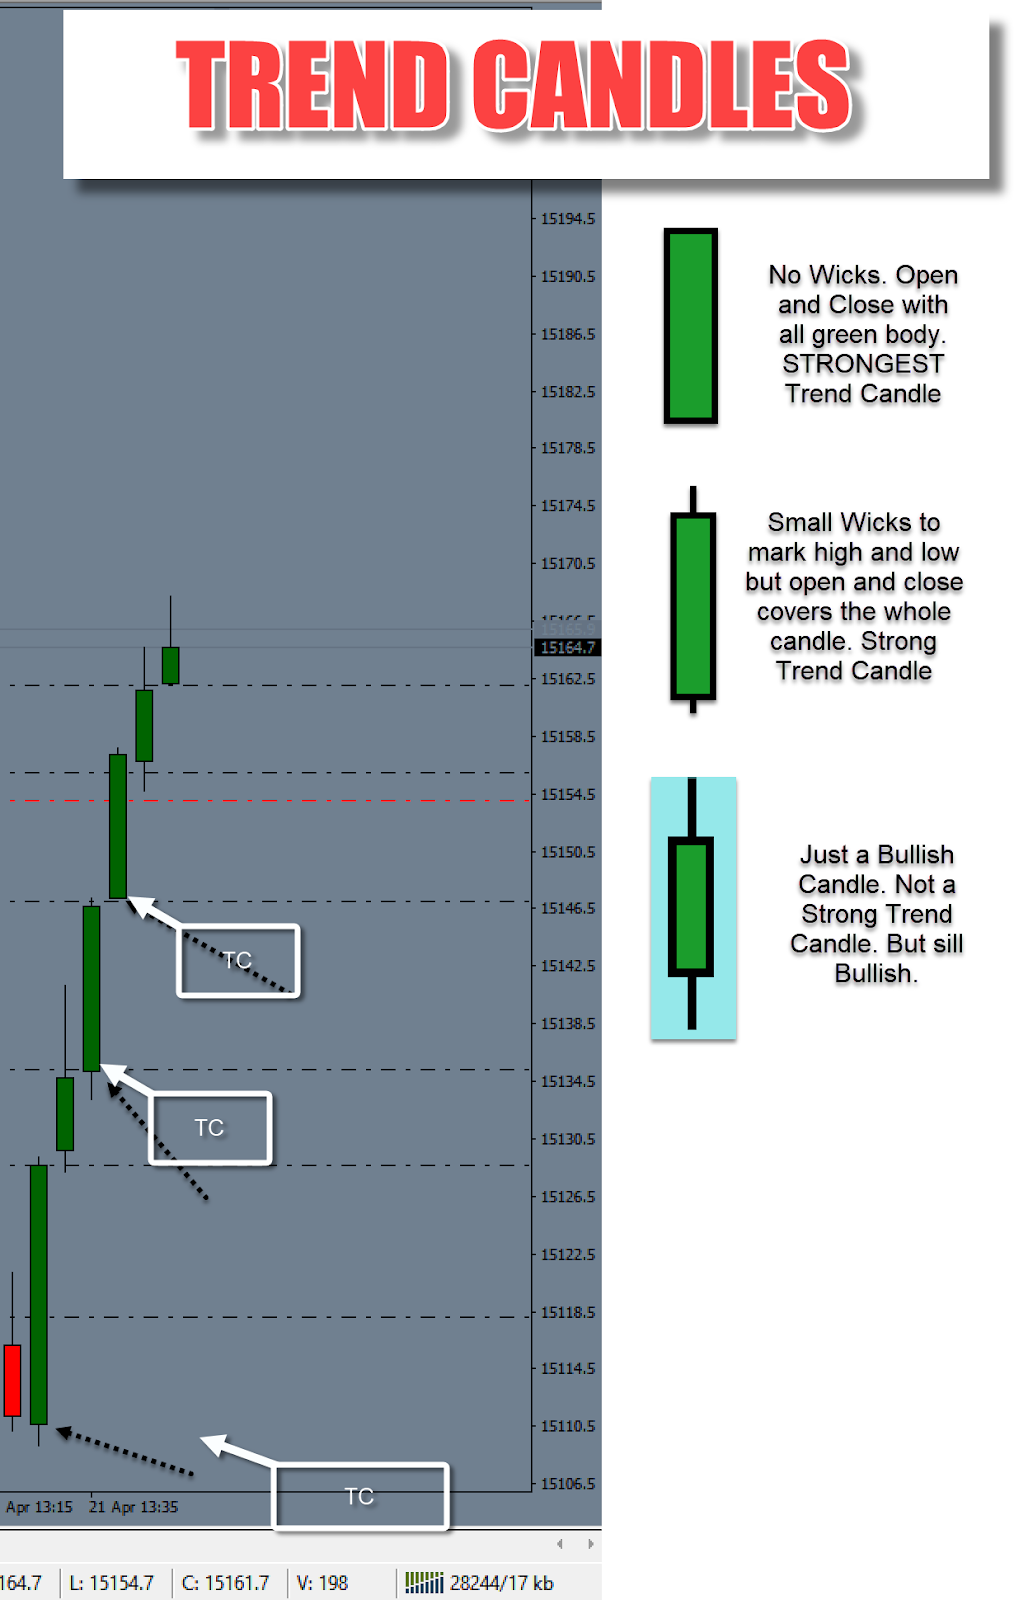
A Trend Candle on the current time frame is a strong bullish or bearish candle that has either no wicks or very small wicks on each side. 80% of more of the candle is made of a Bull or Bear Body. These candles are indication of strong bull or bear activity.
Fractal Geometry of Trend Candle and A Breakout Trend Phase within The Market cycle.
A trend candle of the current time frame might be a breakout on the lower time frame.
