





Banana Indicator
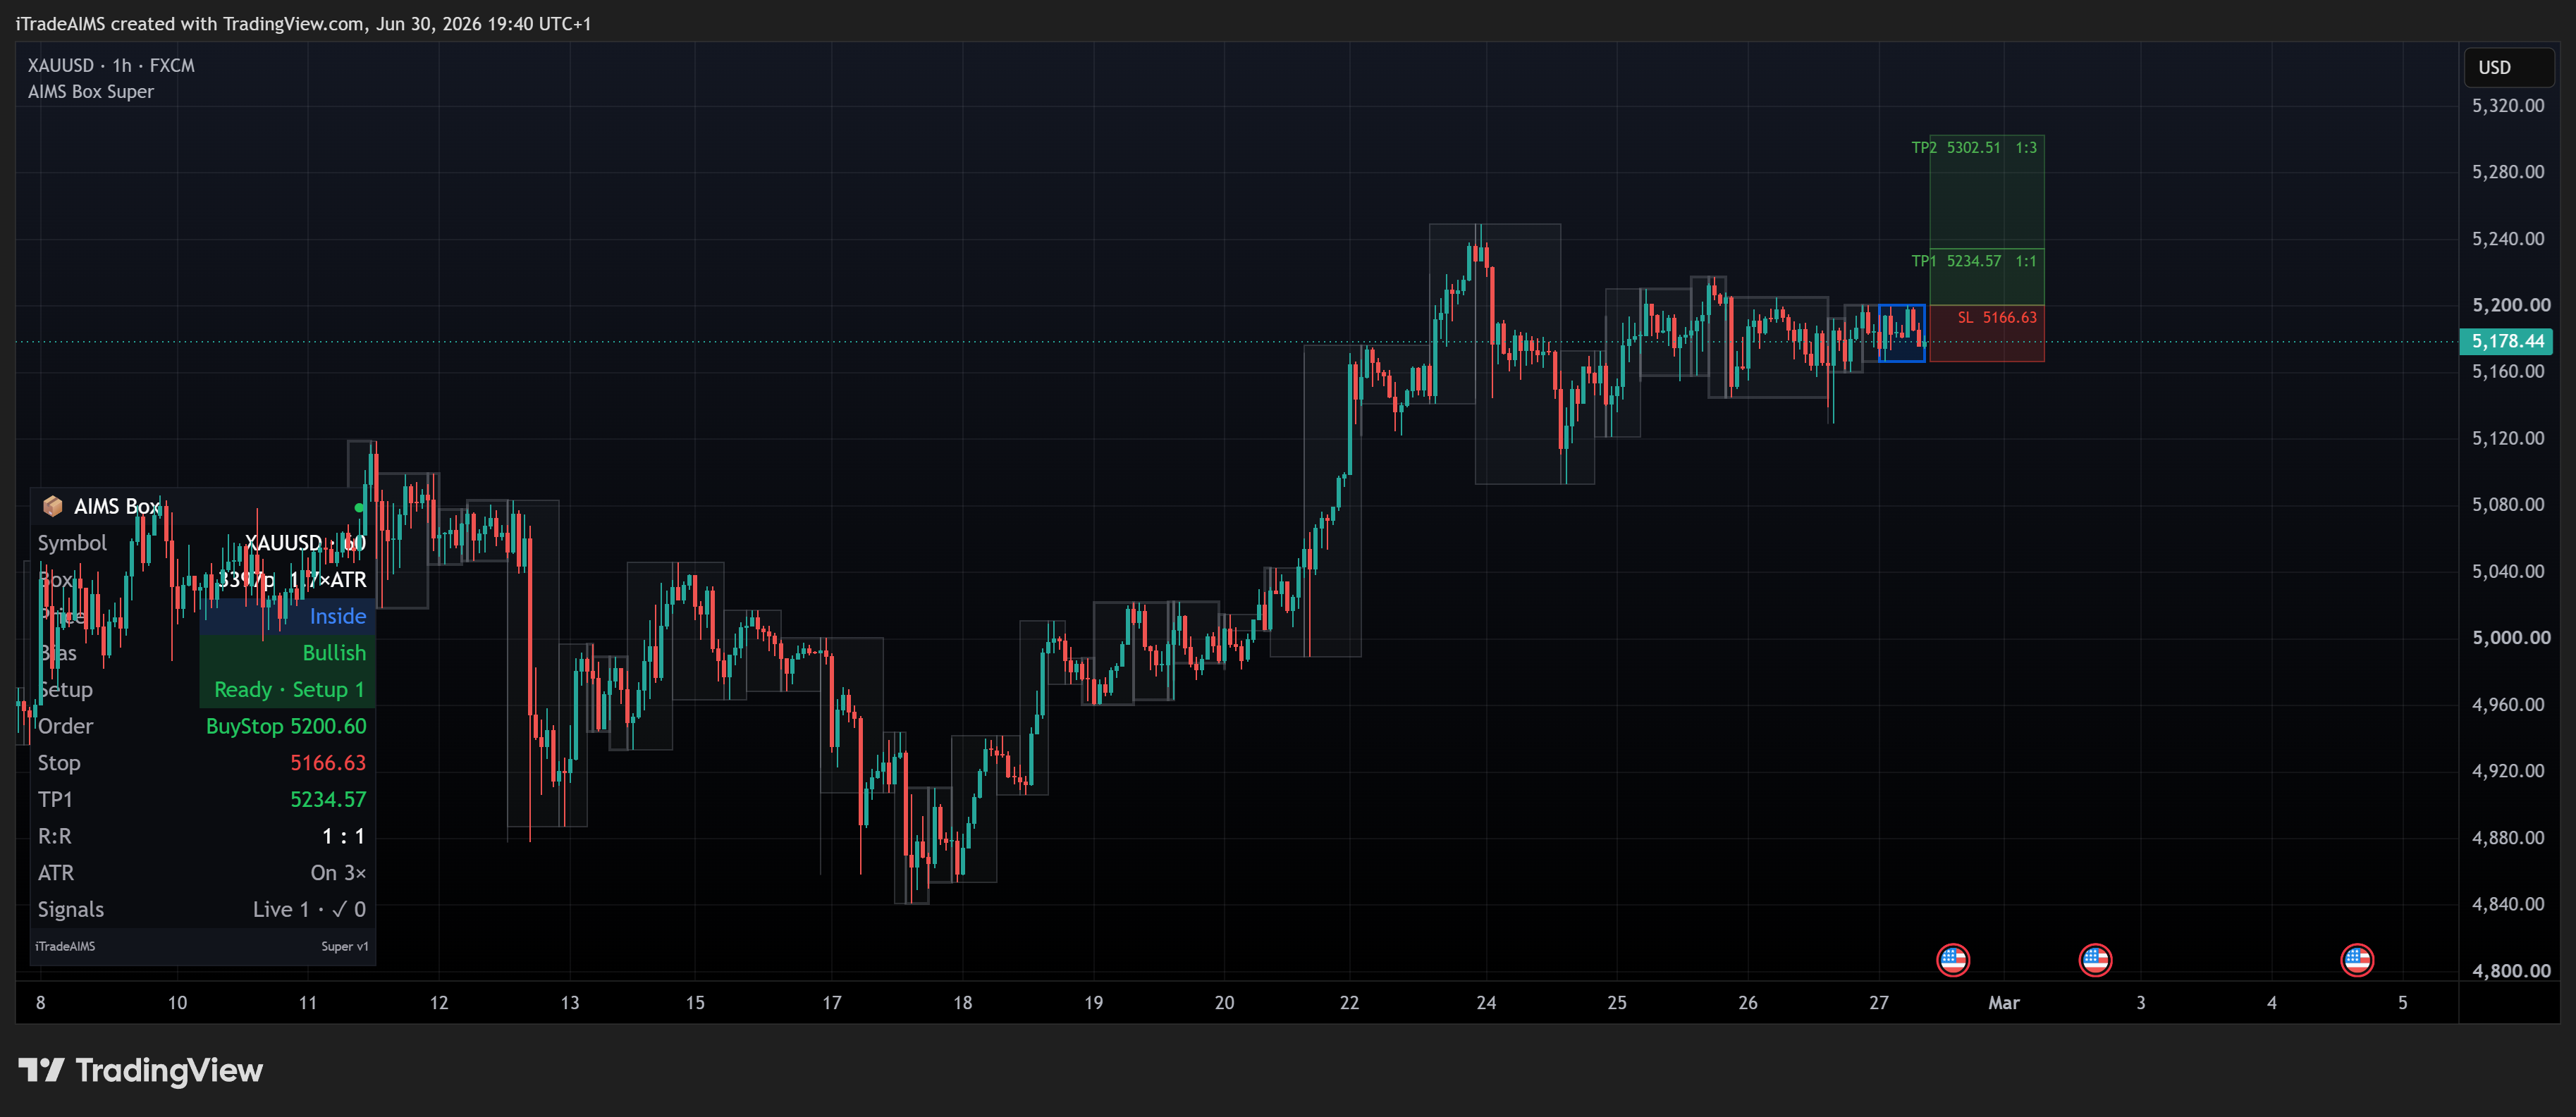
Rule-based chart analysis software engineered to detect pullback-continuation structures with built-in volatility filtering and disciplined risk rules.

Fractal breakout software that identifies consolidation boundaries and provides dynamic trailing stop reference levels.
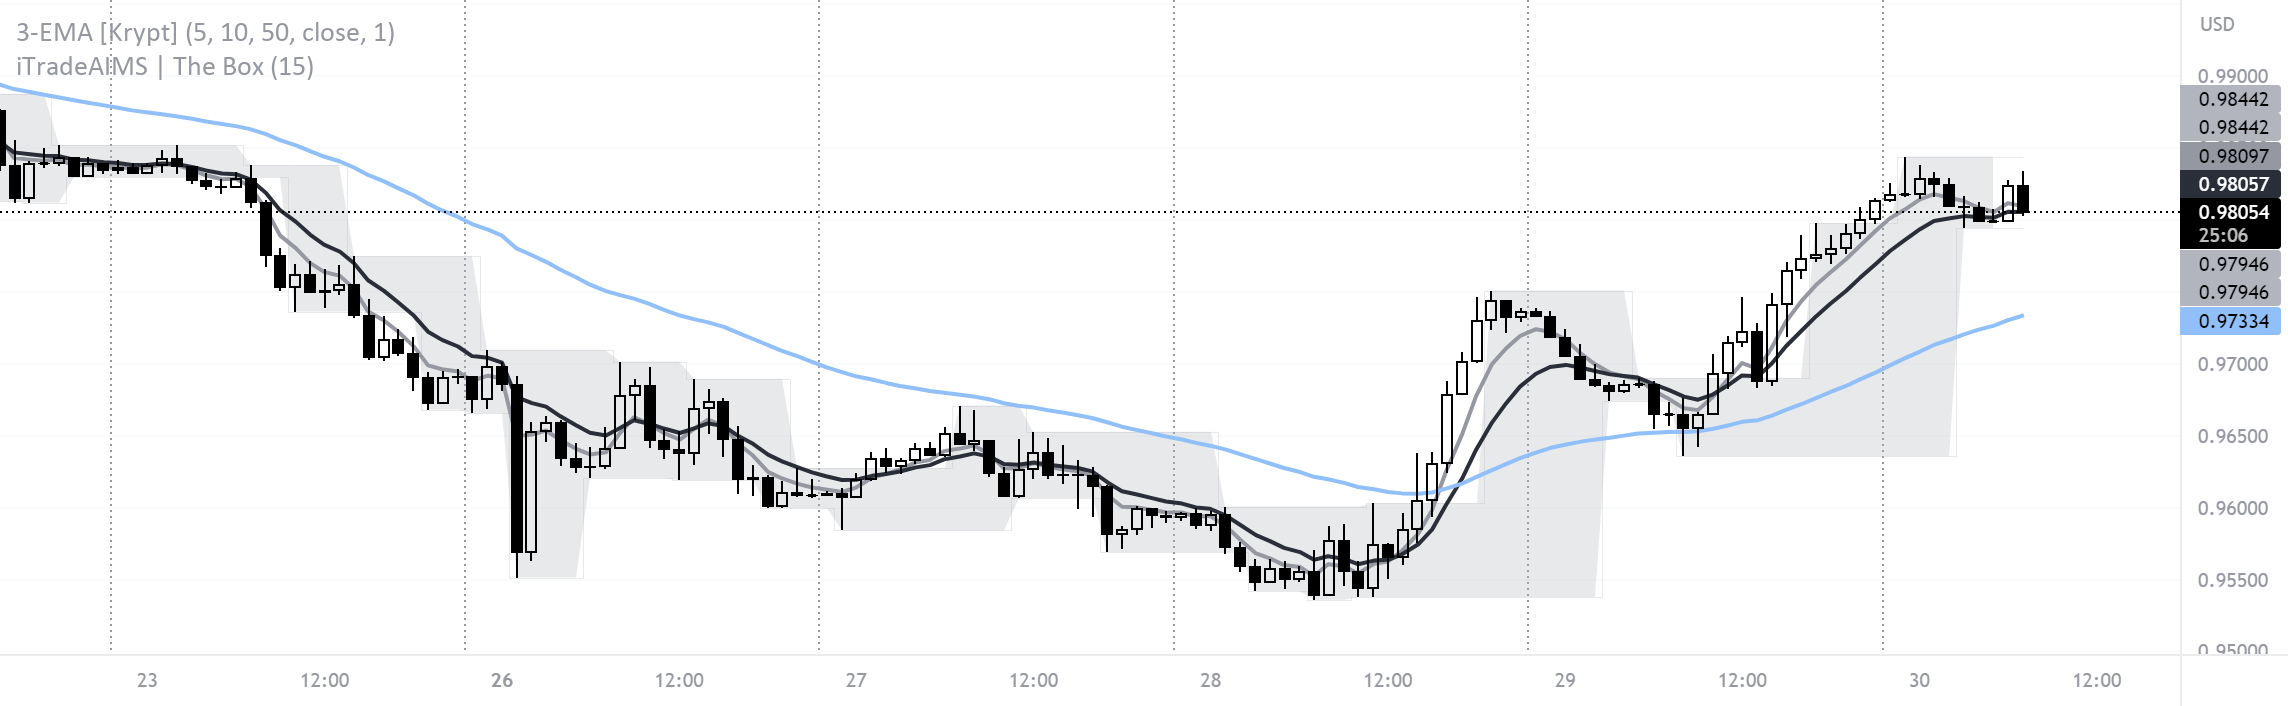
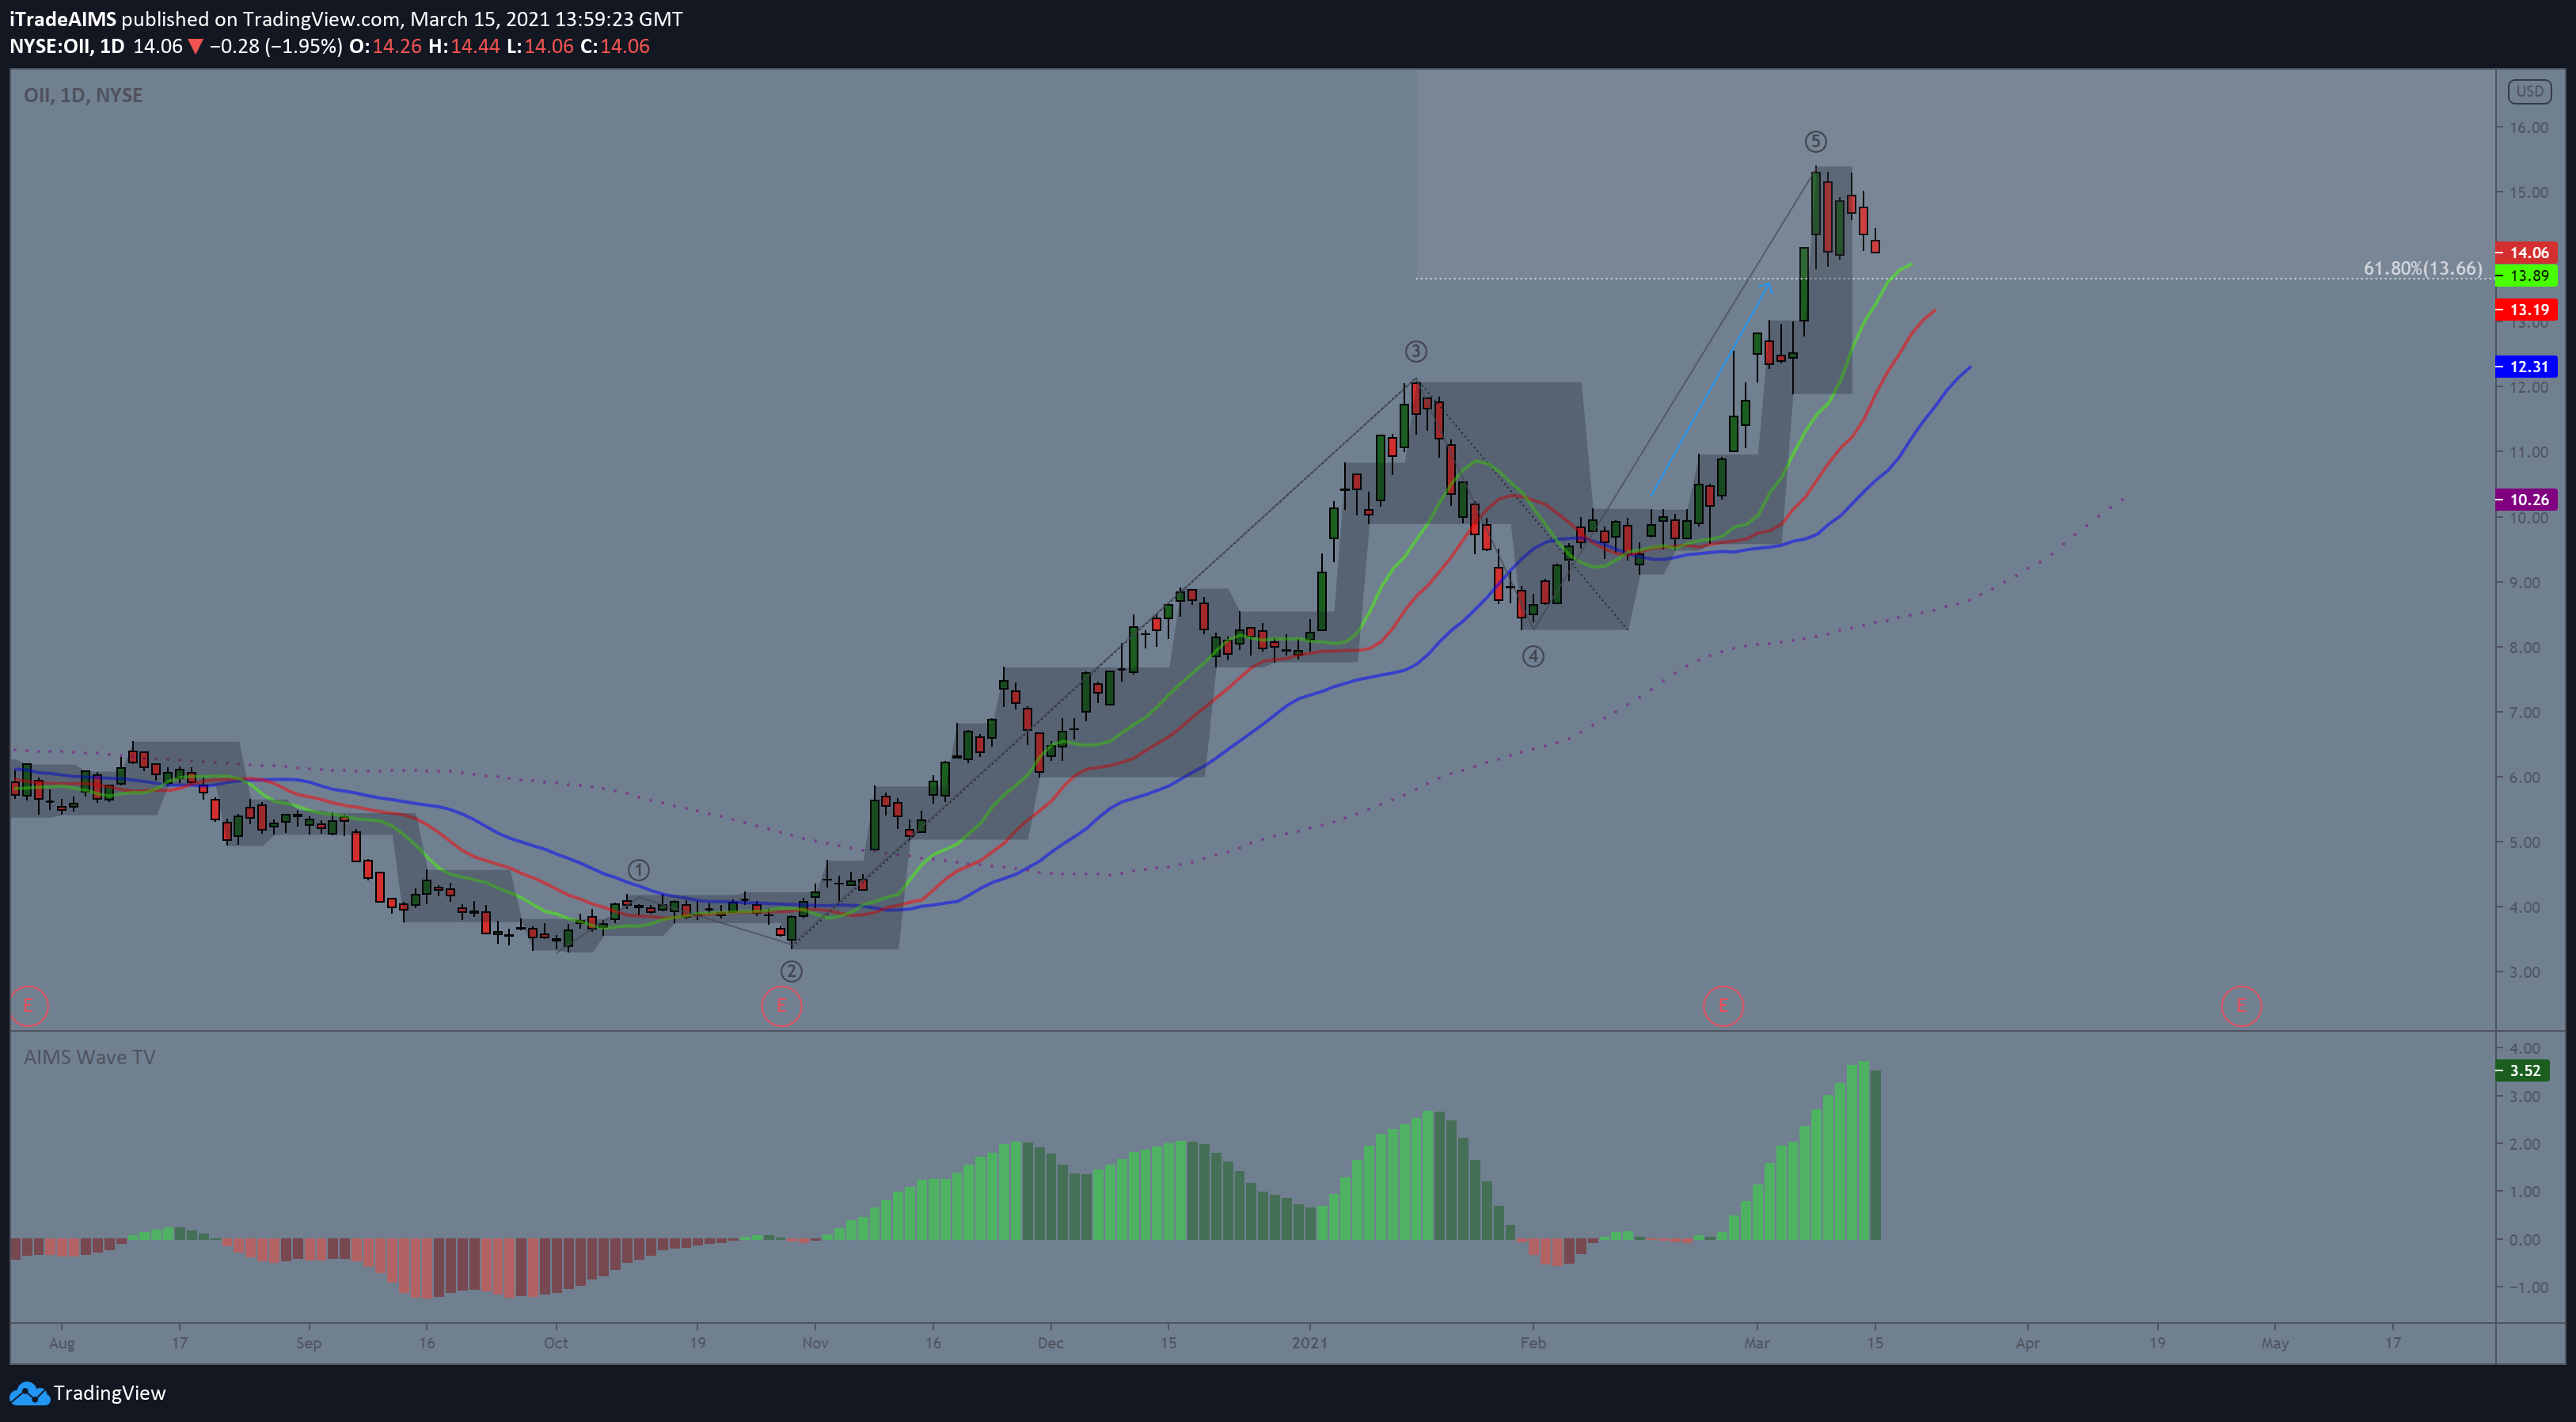
AIMS Box reveals the underlying fractal structure of financial markets by framing consolidation ranges within objective mathematical boundaries. Grounded in chaos theory and fractal geometry, it highlights the transition from market compression to directional expansion.
When price breaks out of a defined box boundary, the tool provides an immediate visual prompt indicating an emerging breakout setup. As the trend develops, successive box levels serve as dynamic reference points for trailing stops, helping you manage trade risk methodically.
AIMS Box standardizes breakout analysis. By providing unambiguous geometric boundaries, it gives you a systematic framework to plan entries and manage open risk with consistent discipline.
You will get instant access immediately upon order completion. You don't need to email anyone.
They are mathematically plotted around multi-bar fractal highs and lows during market consolidation.
Yes. Our documentation walks you through adding it to your chart in a couple of minutes.
Yes. Progressive box levels serve as objective reference points for systematic trailing stops.
Discover more trading tools and algorithmic systems designed to enhance your edge.
Rule-based chart analysis software engineered to detect pullback-continuation structures with built-in volatility filtering and disciplined risk rules.

Advanced Elliott Wave momentum software that automatically maps 5-wave cycles and calculates structural Fibonacci target zones.
Algorithmic market structure mapping software providing systematic trend analysis, key level visualization, and customizable alert logic.