
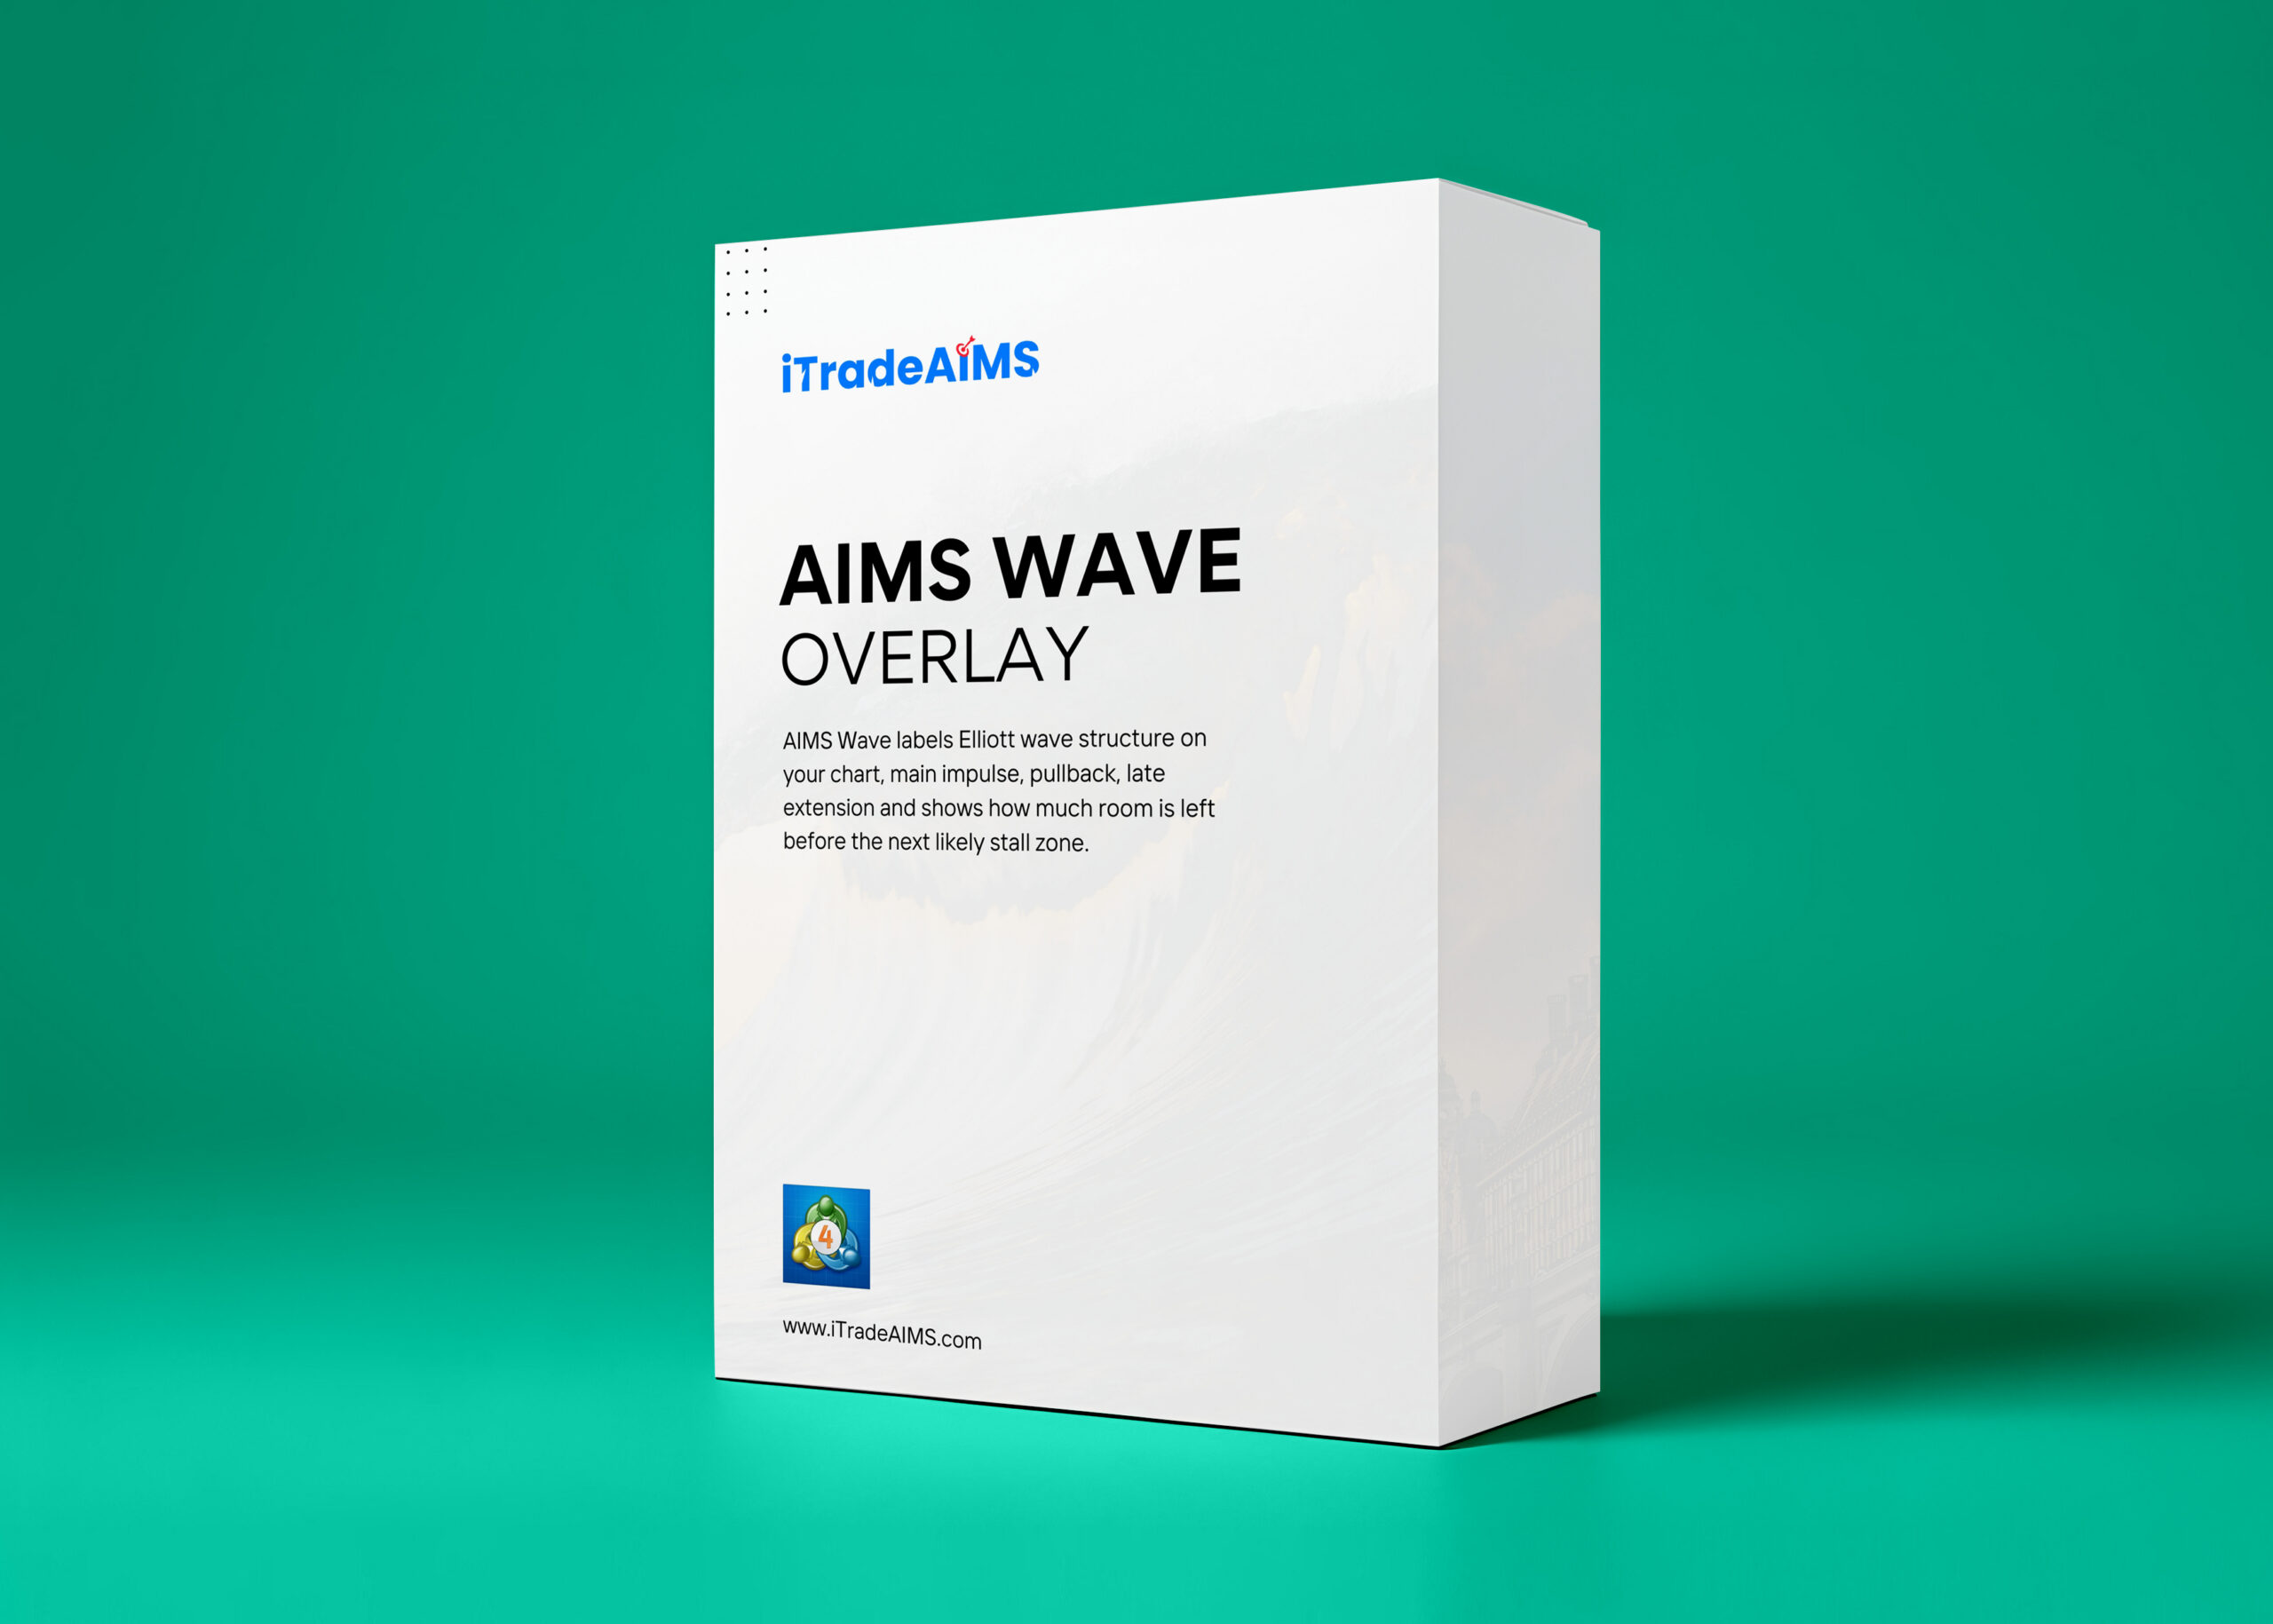



AIMS Wave Overlay

AIMS Wave Overlay

Dedicated 4-color candlestick momentum overlay software mapping impulse acceleration and corrective digestion directly onto price bars.

Key Features:
  • 4-Color Wave Candlestick Overlay
  • Impulse vs Digestion Mapping
  • Zero-Lag Momentum Calculation

AIMS Wave Overlay is a specialized charting utility that translates sophisticated oscillator momentum waves into intuitive, 4-color candlestick coloration directly in your main chart window. By embedding momentum intelligence onto the price bars themselves, it eliminates the need to constantly look back and forth between price and sub-window oscillators.

The software clearly separates explosive trend acceleration from healthy corrective digestion. Brightly colored candles (Lime Green and Bright Red) indicate active impulse momentum, while subdued tones (Dark Green and Maroon) signal pullbacks and momentum exhaustion, preventing premature entries during market consolidation.

How It Works

  1. Momentum Acceleration Calculation: Continuously evaluates multi-period median baseline differentials to measure true market momentum.
  2. 4-Color State Classification: Categorizes each bar into bullish impulse, bullish corrective, bearish impulse, or bearish corrective states.
  3. Direct Candlestick Shading: Paints candle bodies and wicks with distinct colors reflecting active momentum regimes in real time.

Key Capabilities

  • Immediate Trend Clarity: Instantly recognize whether market momentum is accelerating or decelerating without secondary charts.
  • Pullback Trap Prevention: Darkened corrective bars warn you when momentum is slowing down, preventing entries into late exhaustion moves.
  • Full Visual Customization: Adjust candle body widths, wick thicknesses, and custom color palettes to suit dark or light chart themes.

Disciplined Chart Workflow

AIMS Wave Overlay unifies price action and momentum analysis into one clean visual language. It keeps your attention locked on the charts while reinforcing disciplined trend and momentum evaluation.

  • Core Wave Overlay Software
  • Wave Color Interpretation Manual
  • Setup & Trading Guide
  • Lifetime Software Updates
  • Dedicated Technical Support
  • 4-Color Wave Candlestick Overlay
  • Impulse vs Digestion Mapping
  • Zero-Lag Momentum Calculation
  • Non-Repainting Logic
  • Fully Customizable
  • Clean Chart Integration
Will I instantly get access or do I need to email the team?

You will get instant access immediately upon order completion. You don't need to email anyone.

What do the four candle colors represent?

Bright colors (Lime/Red) represent active impulse acceleration, while dark colors (Dark Green/Maroon) represent corrective digestion and deceleration.

Can I use this alongside my existing indicators?

Yes. It acts as an unobtrusive visual overlay directly on your price candles, harmonizing with any additional technical tools.

Does it repaint historical candle colors?

No. The momentum state locks permanently when each candlestick closes, preserving full historical accuracy.

Related Showcase

More Products & Indicators

Discover more trading tools and algorithmic systems designed to enhance your edge.

Tradingview Mt4 Mt5
Best Selling

Banana Indicator

$497 one-time

Rule-based chart analysis software engineered to detect pullback-continuation structures with built-in volatility filtering and disciplined risk rules.
AIMS NAS

$2997 one-time

Algorithmic index structure software engineered for high-velocity index momentum, opening range breakouts, and session trend continuation.

AIMS Hunt Dot

FREE one-time

Inside-bar compression detection software identifying multi-bar volatility squeezes aligned with macro momentum and trend boundaries.