Trends, Momentum and Trading Range
Trading Ranges, Trends, and Momentum
The market is either trending or range. Likewise, a candle is either a trending candle or a range candle. The trend candles have smaller wicks and bigger bodies. The range candles have bigger wicks and smaller bodies.
There are only 2 Types of Candles and 2 Types of Markets
I will always be aware whether the market is in a 1 minute or 5 minute or hourly time frame range. I will be aware of those ranges within ranges and I will keep an eye on the levels.
Keep it BINARY to Help Make Decision Making Easy
I will keep it BINARY: At any given point
- A Candle is Either a Trend or a Range Candle
- The market is either in a trend or range
Questions to Ask: Is the market in a trend or a range?
Use pullbacks ONLY when market is Trending
Use Reversals ONLY when market is Stuck within clearly defined range
And USE Pullback Entries and Trend Trading MORE than Reversals.
DO NOT SCALP unless it is time for scalping (which is almost never)
A Breakout / Momentum Phase (green) followed by a bear trend (a trend channel) and then A Trading Range.
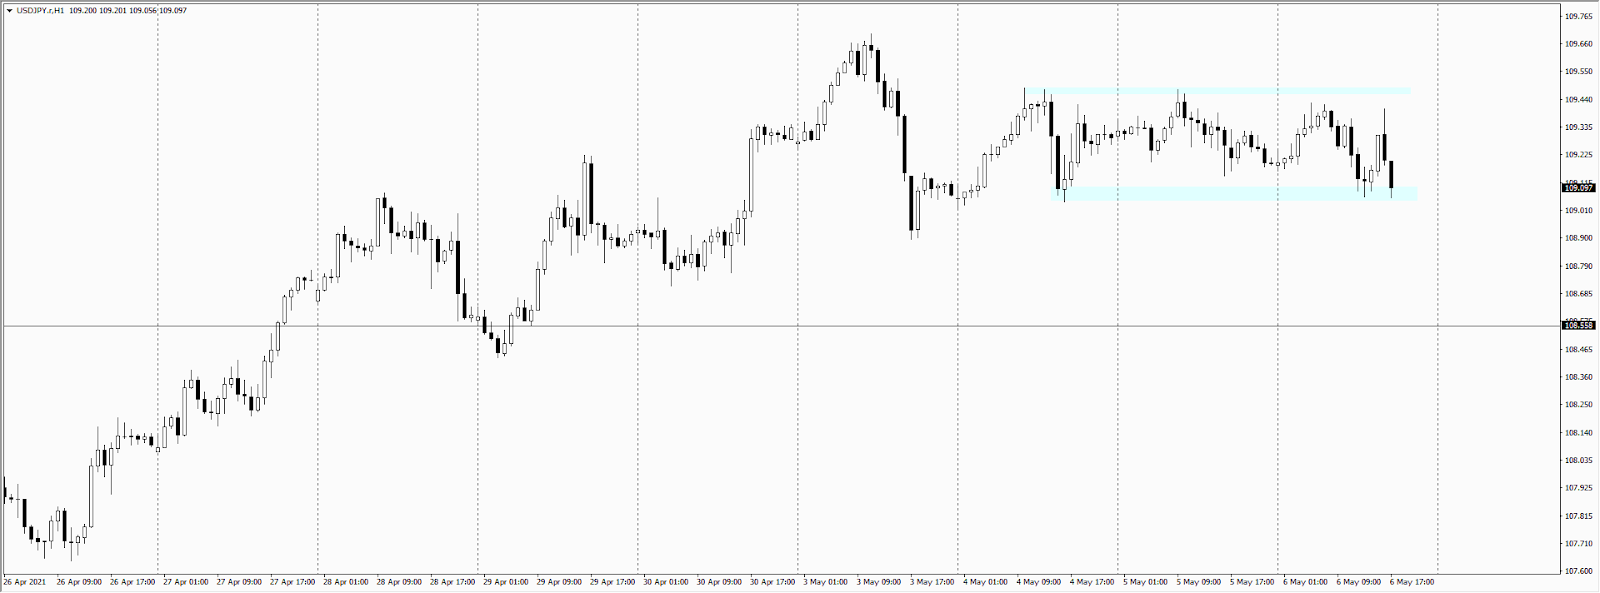
A Tight Trading Range on the USDJPY Hourly Chart.
The Market Trends in 3 Ways
- Breakout Phase (Momentum with Trend Candles no Pullbacks)
- A Tight or Wider Trending Channel (Small Pullbacks)
- A Very Wide Trend Channel where both bulls and bears could make money.
The Market Remains in Two Types of Trading Ranges
- A TIGHT Trading Range or what we call the Tight Boxes (Nobody can make money here, Do Not Trade.
- A WIDE (Tall) Trading range where the distance between the Support and Resistance is wide enough for both bulls and bears to make money.
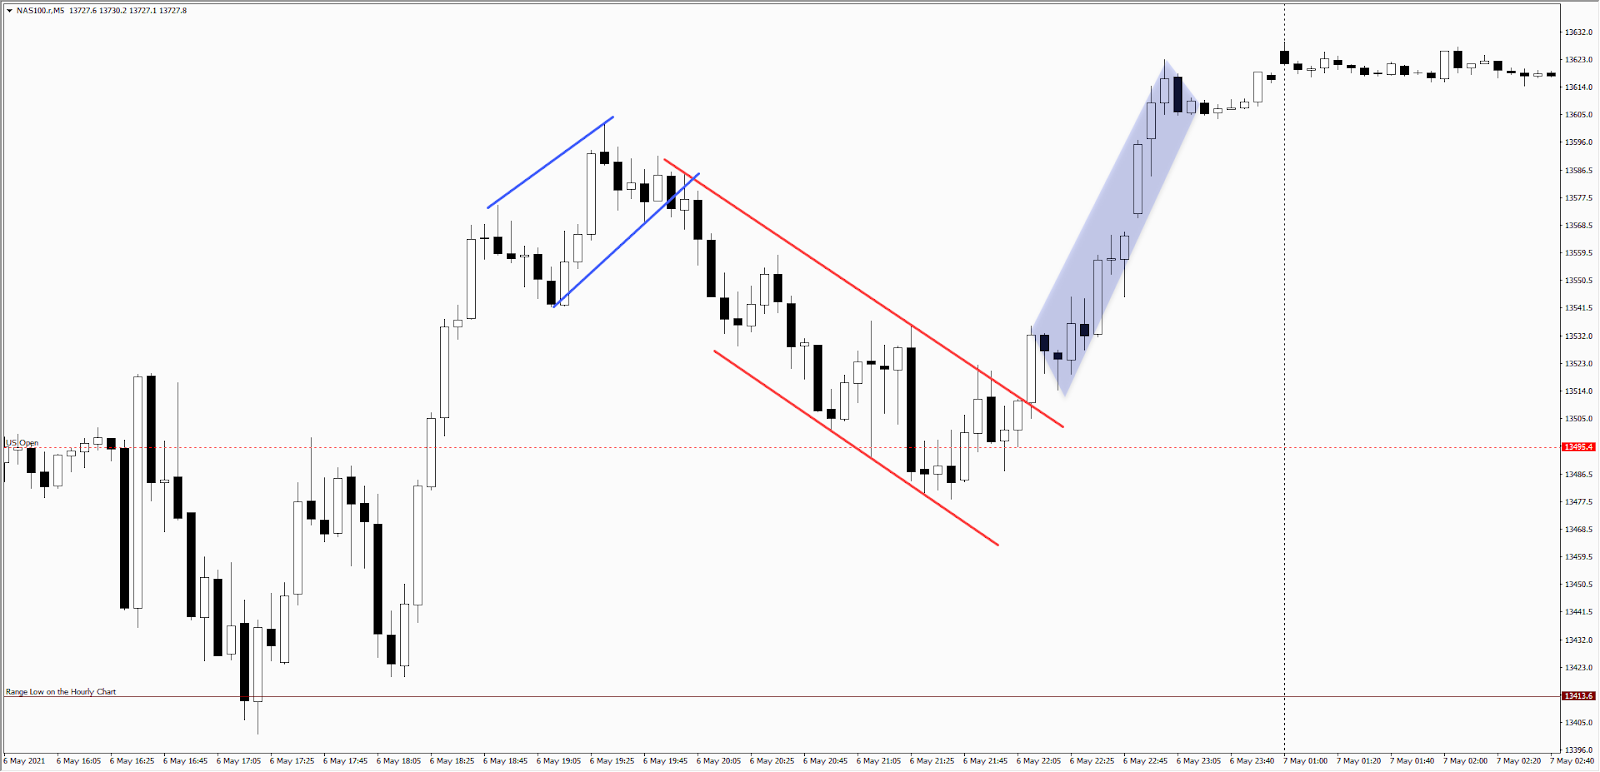
A Breakout – A Tight Trend Channel and Trading Range
Let’s look at this chart of NASDAQ100 on the 5 minute time frame. I have marked the parts where the market broke out into a trend. The blue shaded area is the Breakout Candles. On a higher time frame, this will be just 1 or 2 Trend Candles. On a Lower time frame, it will be a series of trend candles with smaller bear candles i.e. a tight trend channel.

It did not actually turn into a trading range it turned into a Bear Wave within an Up trend. Followed by Breakout Up Again.
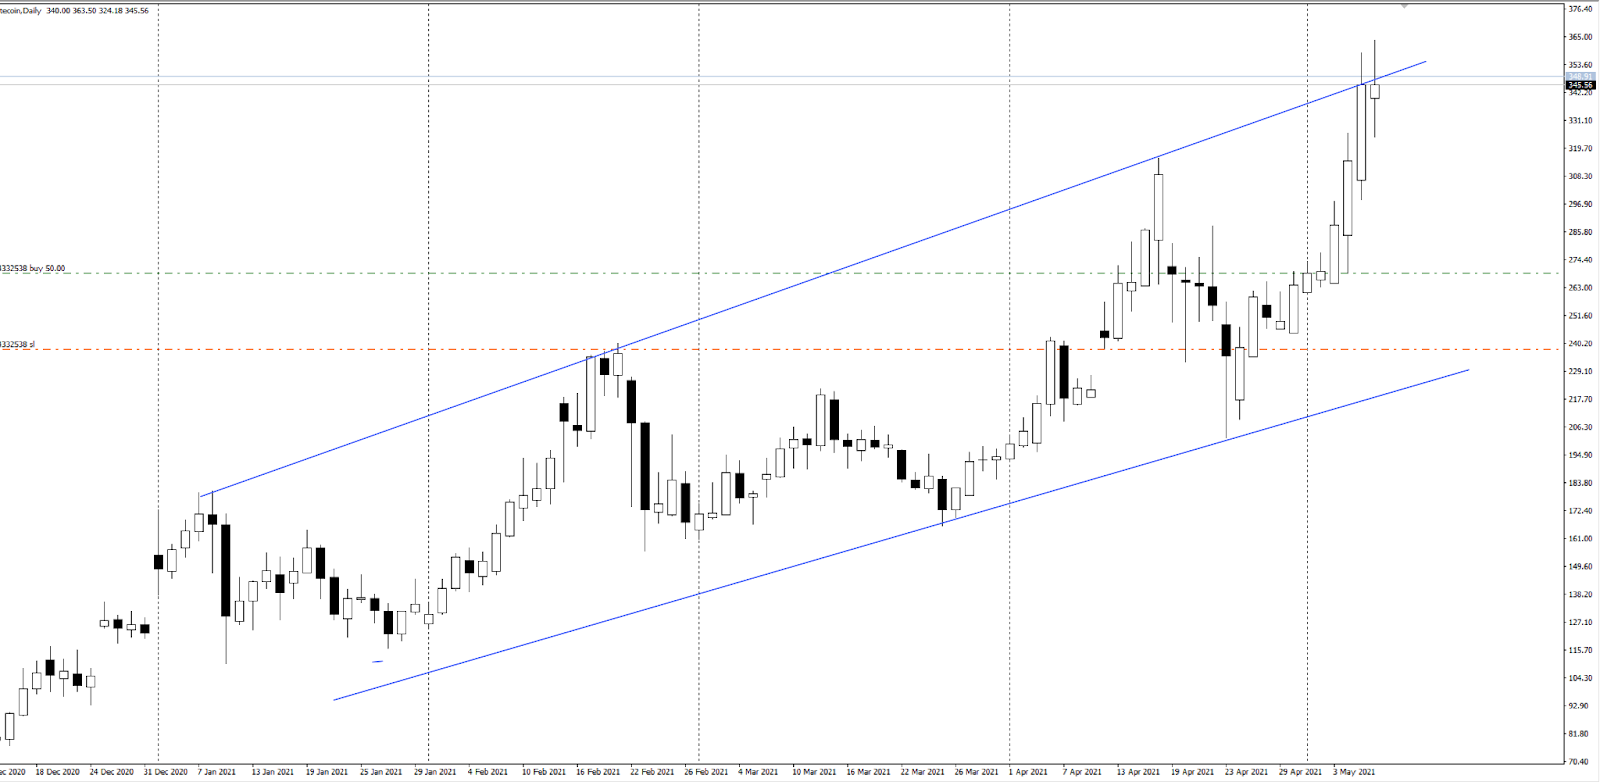
A Wider Bull Channel
Sometimes we see wider channels within big bear and bull waves. Both sides can make money even though its a bull trend, because its wide enough.
The Market Either has A bull Wave or a Bear Wave
When the market is trending the bull wave is often bigger than the bear wave and vice versa for bear markets where bear waves will be longer than bull waves.
When the market is in a trading range the bull and bear waves will have equal lengths but it will also have the following
- A Bull Move/Wave/Leg within a Trading Range, A Pullback within a Bull Leg within a Trading Range
- A Bear Move/Wave/Leg within a Trading Range, A Rally (inverse pullback) within a Bear Leg within a Trading Range
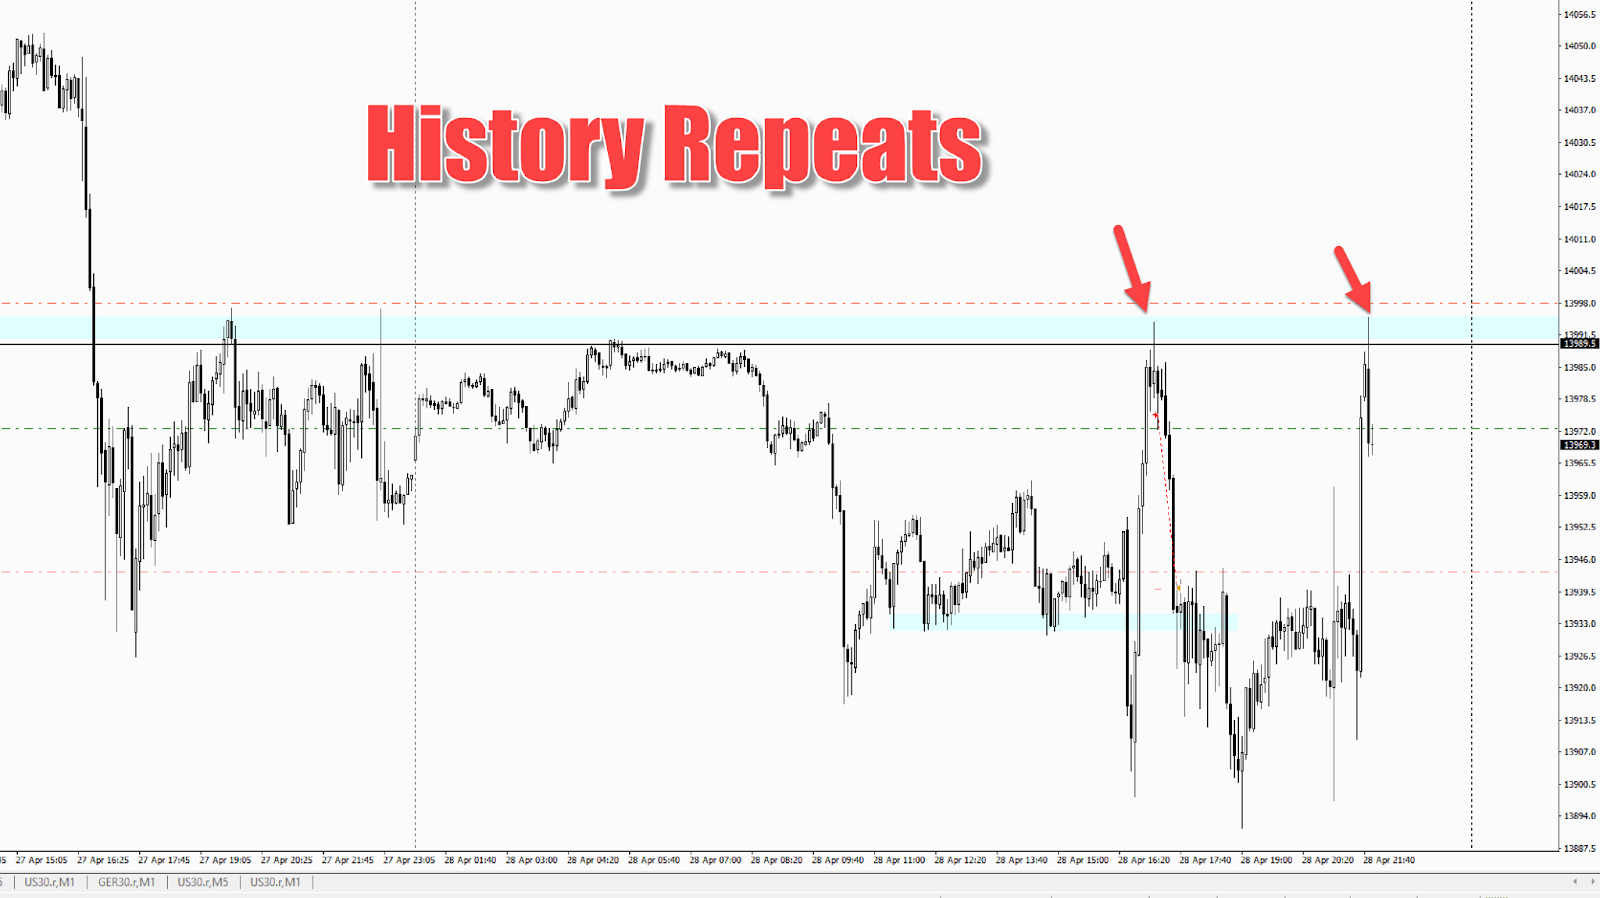
The following chart of the US30 Hourly time frame shows a very wide trading range. I I bought the lows and sold the highs several times until the last sell trade failed and it later turned into a 3 day up trend. (all time highs again)

We also saw a bear trend channel within a trading range. It was possible for both bull and bears to trade and make money during the trading range and inside this bear trend channel
How to Trade Trending Range Phase
When the Hourly chart is trending I will NOT take swing trades against that trend when trading the 5 minute chart but I can take scalp trades against the hourly trend.
When the Hourly chart is in a wide range like it was on the NASDAQ and US30 during the last 2 weeks of April 2021, I will sell the highs of the range and buy the lows using the levels on H1 and price action on the 5 minute chart.
E.g. example these trades
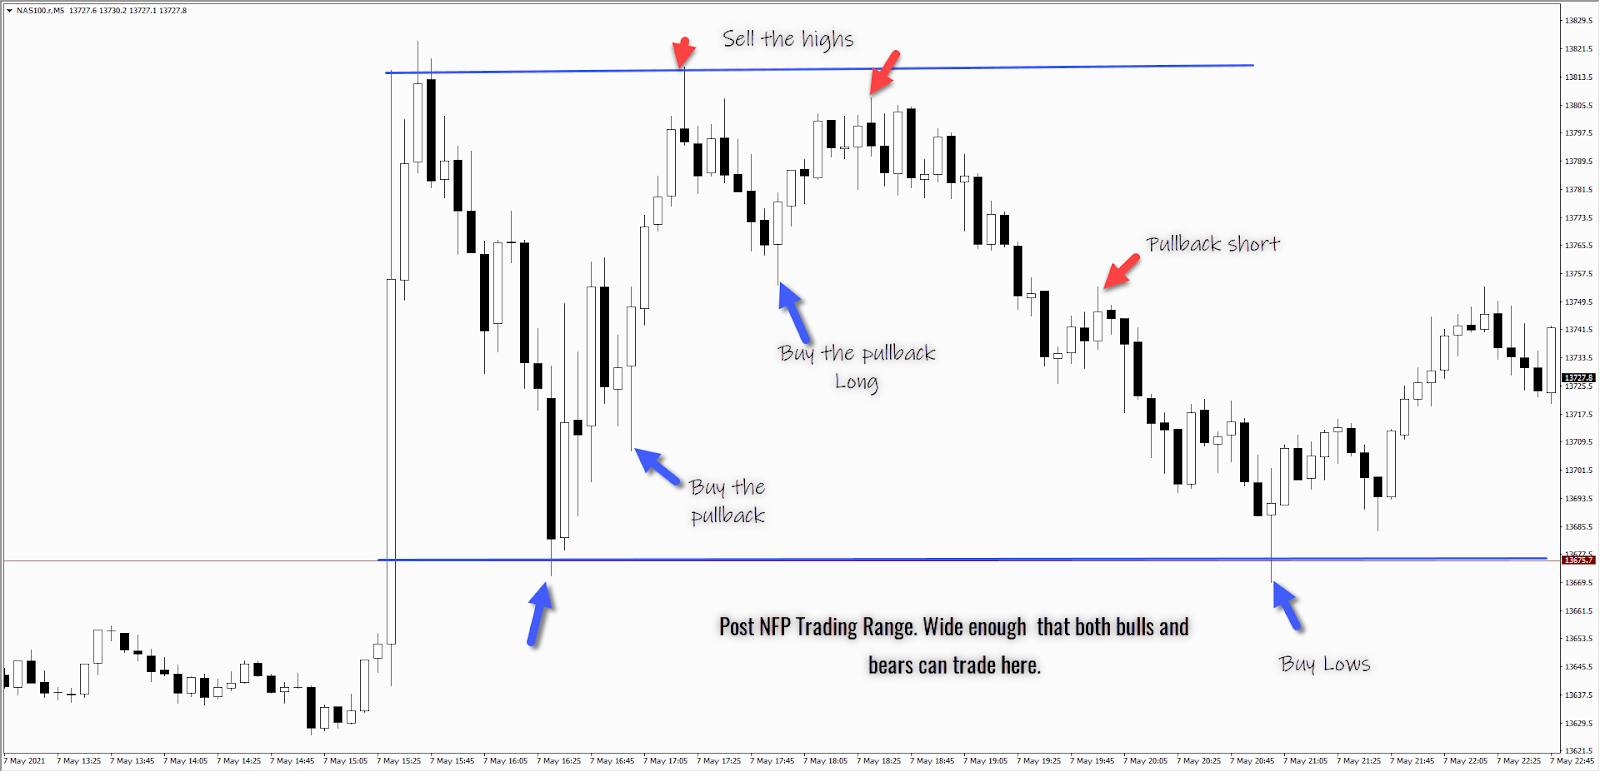
Buying and Selling Wider Trading Ranges on the M5 Chart
NASDAQ 100 Post NFP Wide Range
https://www.screencast.com/t/LBq0qXcOJ
When NOT to DRAW Your Trend Lines?
Trend Lines are simply of mapping your way. It does not mean that price will 100% respect these lines. You’re only creating a pattern with the help of drawing some straight lines.
Use trend lines ONLY during Bull and Bear Trends. To see if they are
a) Parallel or b) converging.
The idea is that you want to see this
- A Range Bound Market either in a Tight or Wider (horizontal channel) RANGE.
- You will see (often) a Breakout (which means series of similar colour candles no pullbacks or very small pullbacks creating a very tight trend channel)
- After that you will often see a few candles pullback 5-10 candles is fine. Or you will see continuation by the channel will converge. The breakout of this type of channel often leads to a good trade in the opposite direction.
Don’t Draw Trend lines when you can see its a RANGE. Just Draw the horizontal lines and consider it a range.
Below is a Chart of NASDAQ 100 M5 on 10th of May 2021. The Market has been slow today and all the indices have done at at least 3 Bullish Days.
I am long on the Nasdaq and Ger30 at this moment. The Nasdaq 100 is in a sideways RANGE rather than a channel.
