This weeks lessons and deliberations have lead to something interesting. I was going through my charts and trades and yours and doug’s ideas. I was comparing the KC and the LOBOT.
Note: This article does not explain what is a pullback method. Here I am comparing two ways to trade pullbacks.  Check out this article on When and How to Buy on a Pullback
also check out How and Why You Should Learn The Pullback Method
I thought I’ll share my observations with you here.
The KC (Keltner Channel)
– is good for 1:1 (or 1:2 depending on where you put your SL) Targets
– will give you signals with deeper retracement
– will make you stay out when markets are moving strongly.
compare that to 10/20
LOBOT Method
– is good for 1:1 tgo 1:20 and more
– will give you signals with shallower retracement as well, such as 2 candle or 3 candle pullback
– will allow you to ONLY trade when market is STRONGLY moving.
I really do think that we should stick to 10/20 on the M1 or M5 charts… Note: I am not saying only stick to M1 or M5. I’m saying if you’re trading the DAX30 or US30 on the 5 of 1 minute chart, that it would better to use 10/20 instead of the KC but read on because I have a different conclusion at the end
Lets have a look at some charts now.
KC vs the LOBOt Pullback
The KC and the lOBOT are both pullback methods but the LOBOT also has other entries etc. But thats besides the point here.
Here I want to show the difference between the pullback fit for KC method vs the pullback fit for 10/20 lobot method
Chart 1 – This type of pullback is fit for KC
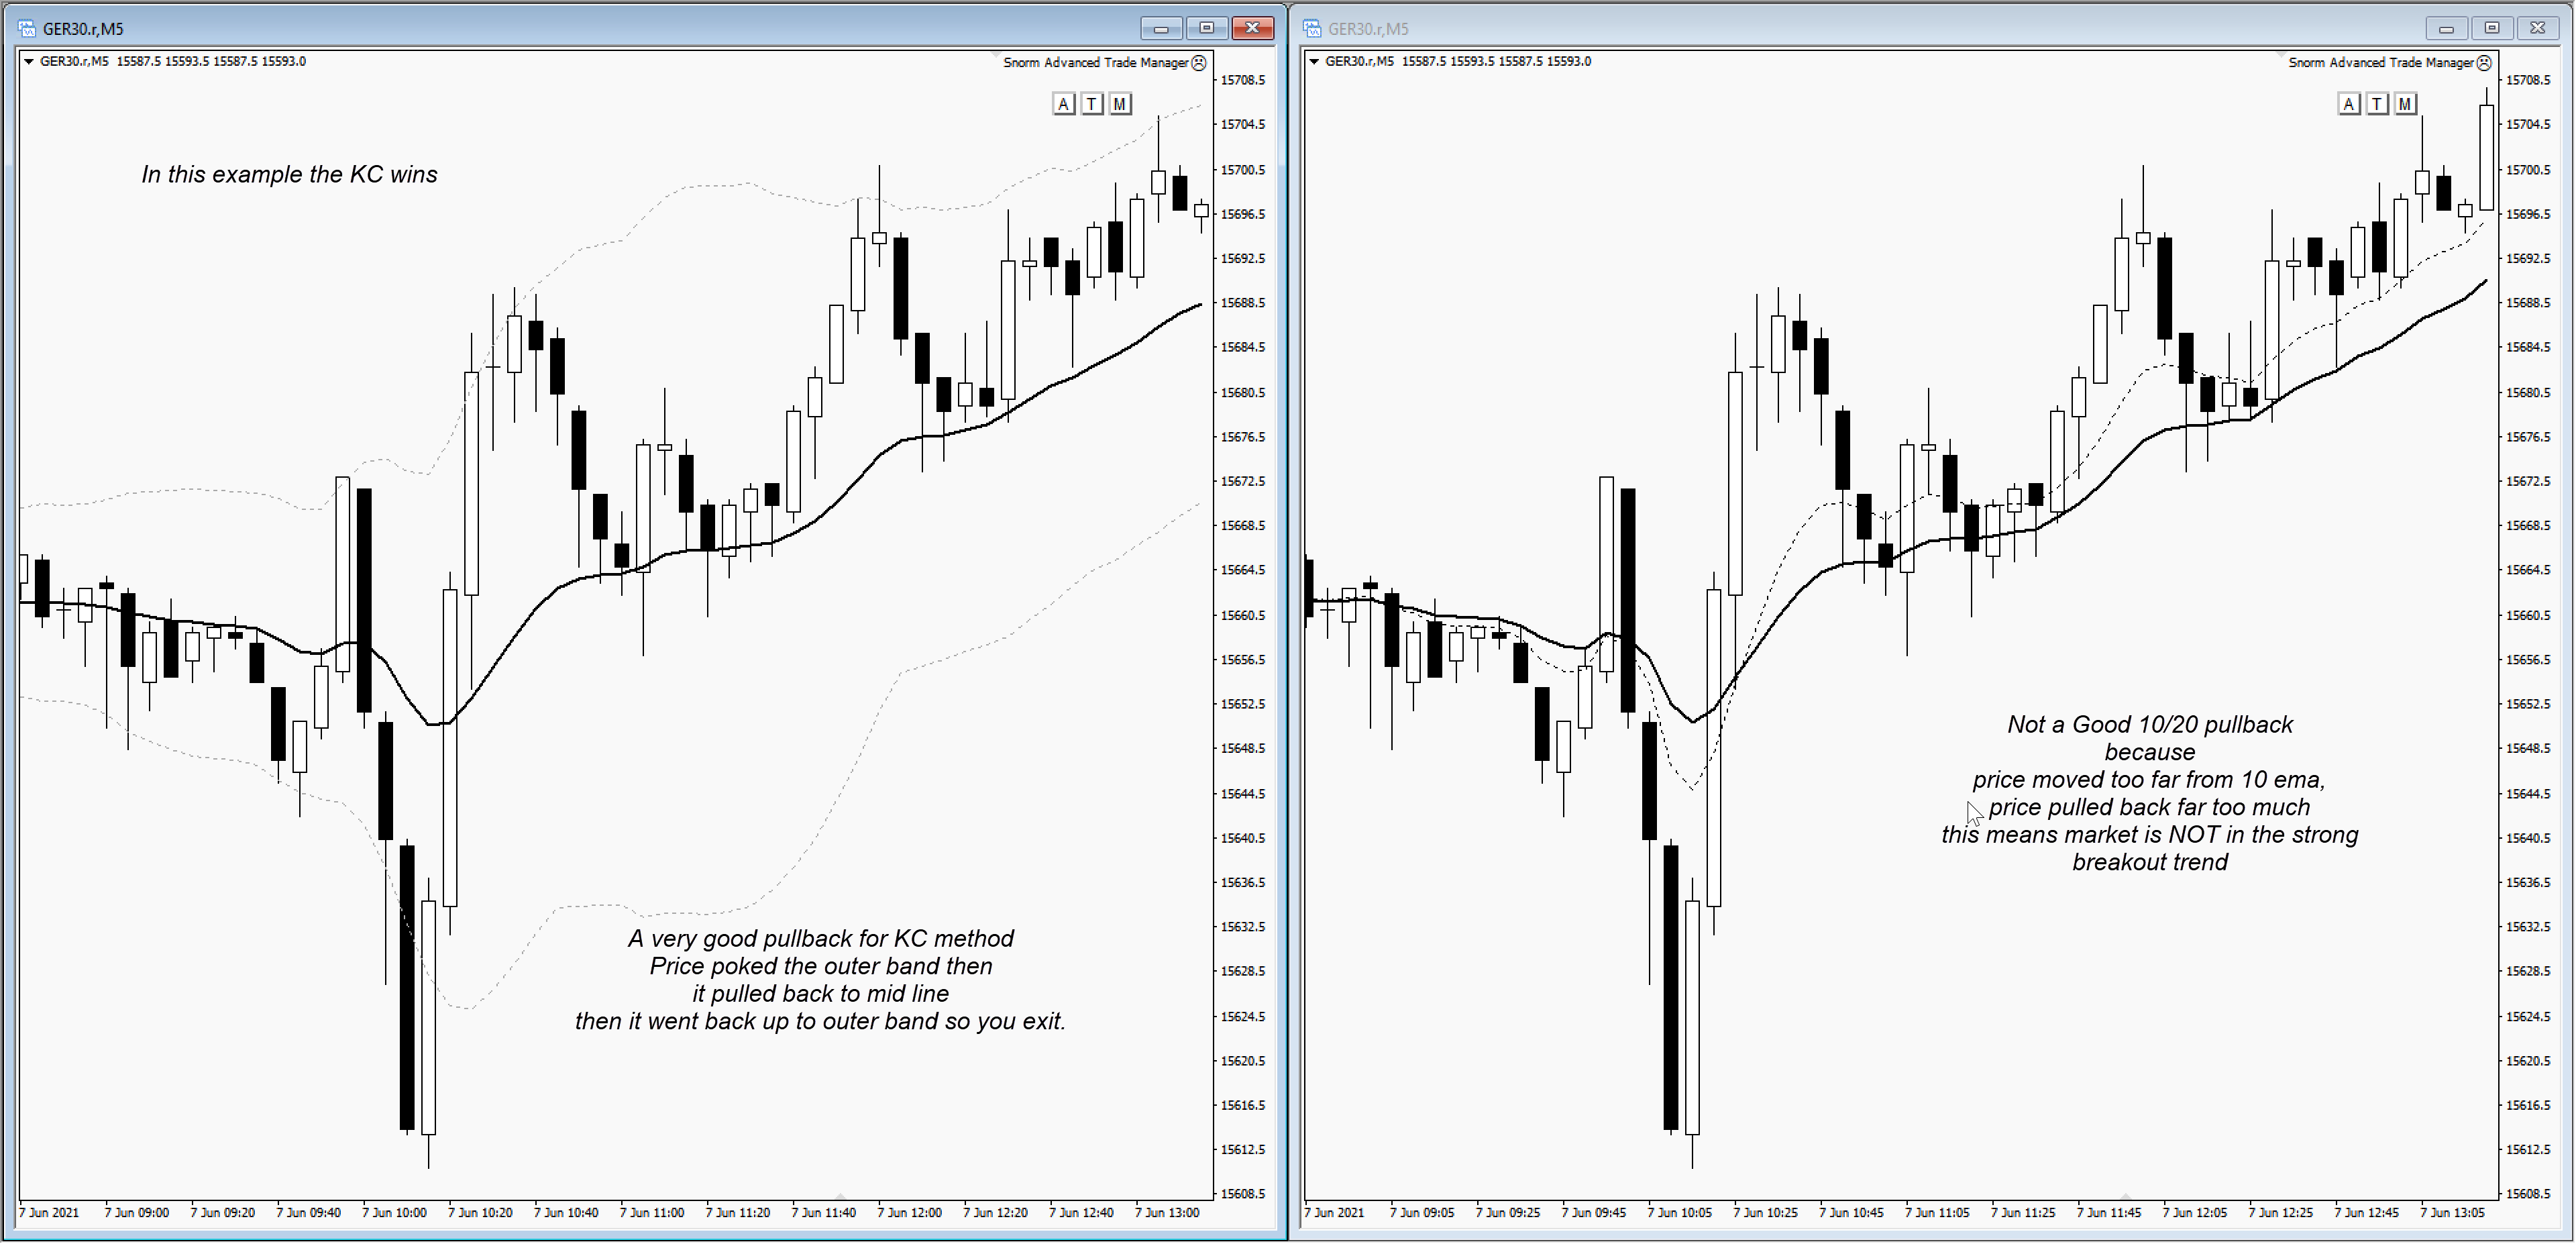
Chart 2 – This type of pullback is fit for Lobot 10/20 method
This type of pullback is suitable for the lobot method. I personally like this type because I like to see the market moving faster and quicker with momentum as opposed to a market that does a 50% retrace like the chart above.
Price is out of the band hence you cannot make an entry on this type of breakout and pullback using the KC method.
The KC method trigger only when price pokes out of the band and then comes back to the mid line.
For the KC method when price is out of band you’re supposed to be looking for either “mean reversion” i.e. reversals or looking for exits.
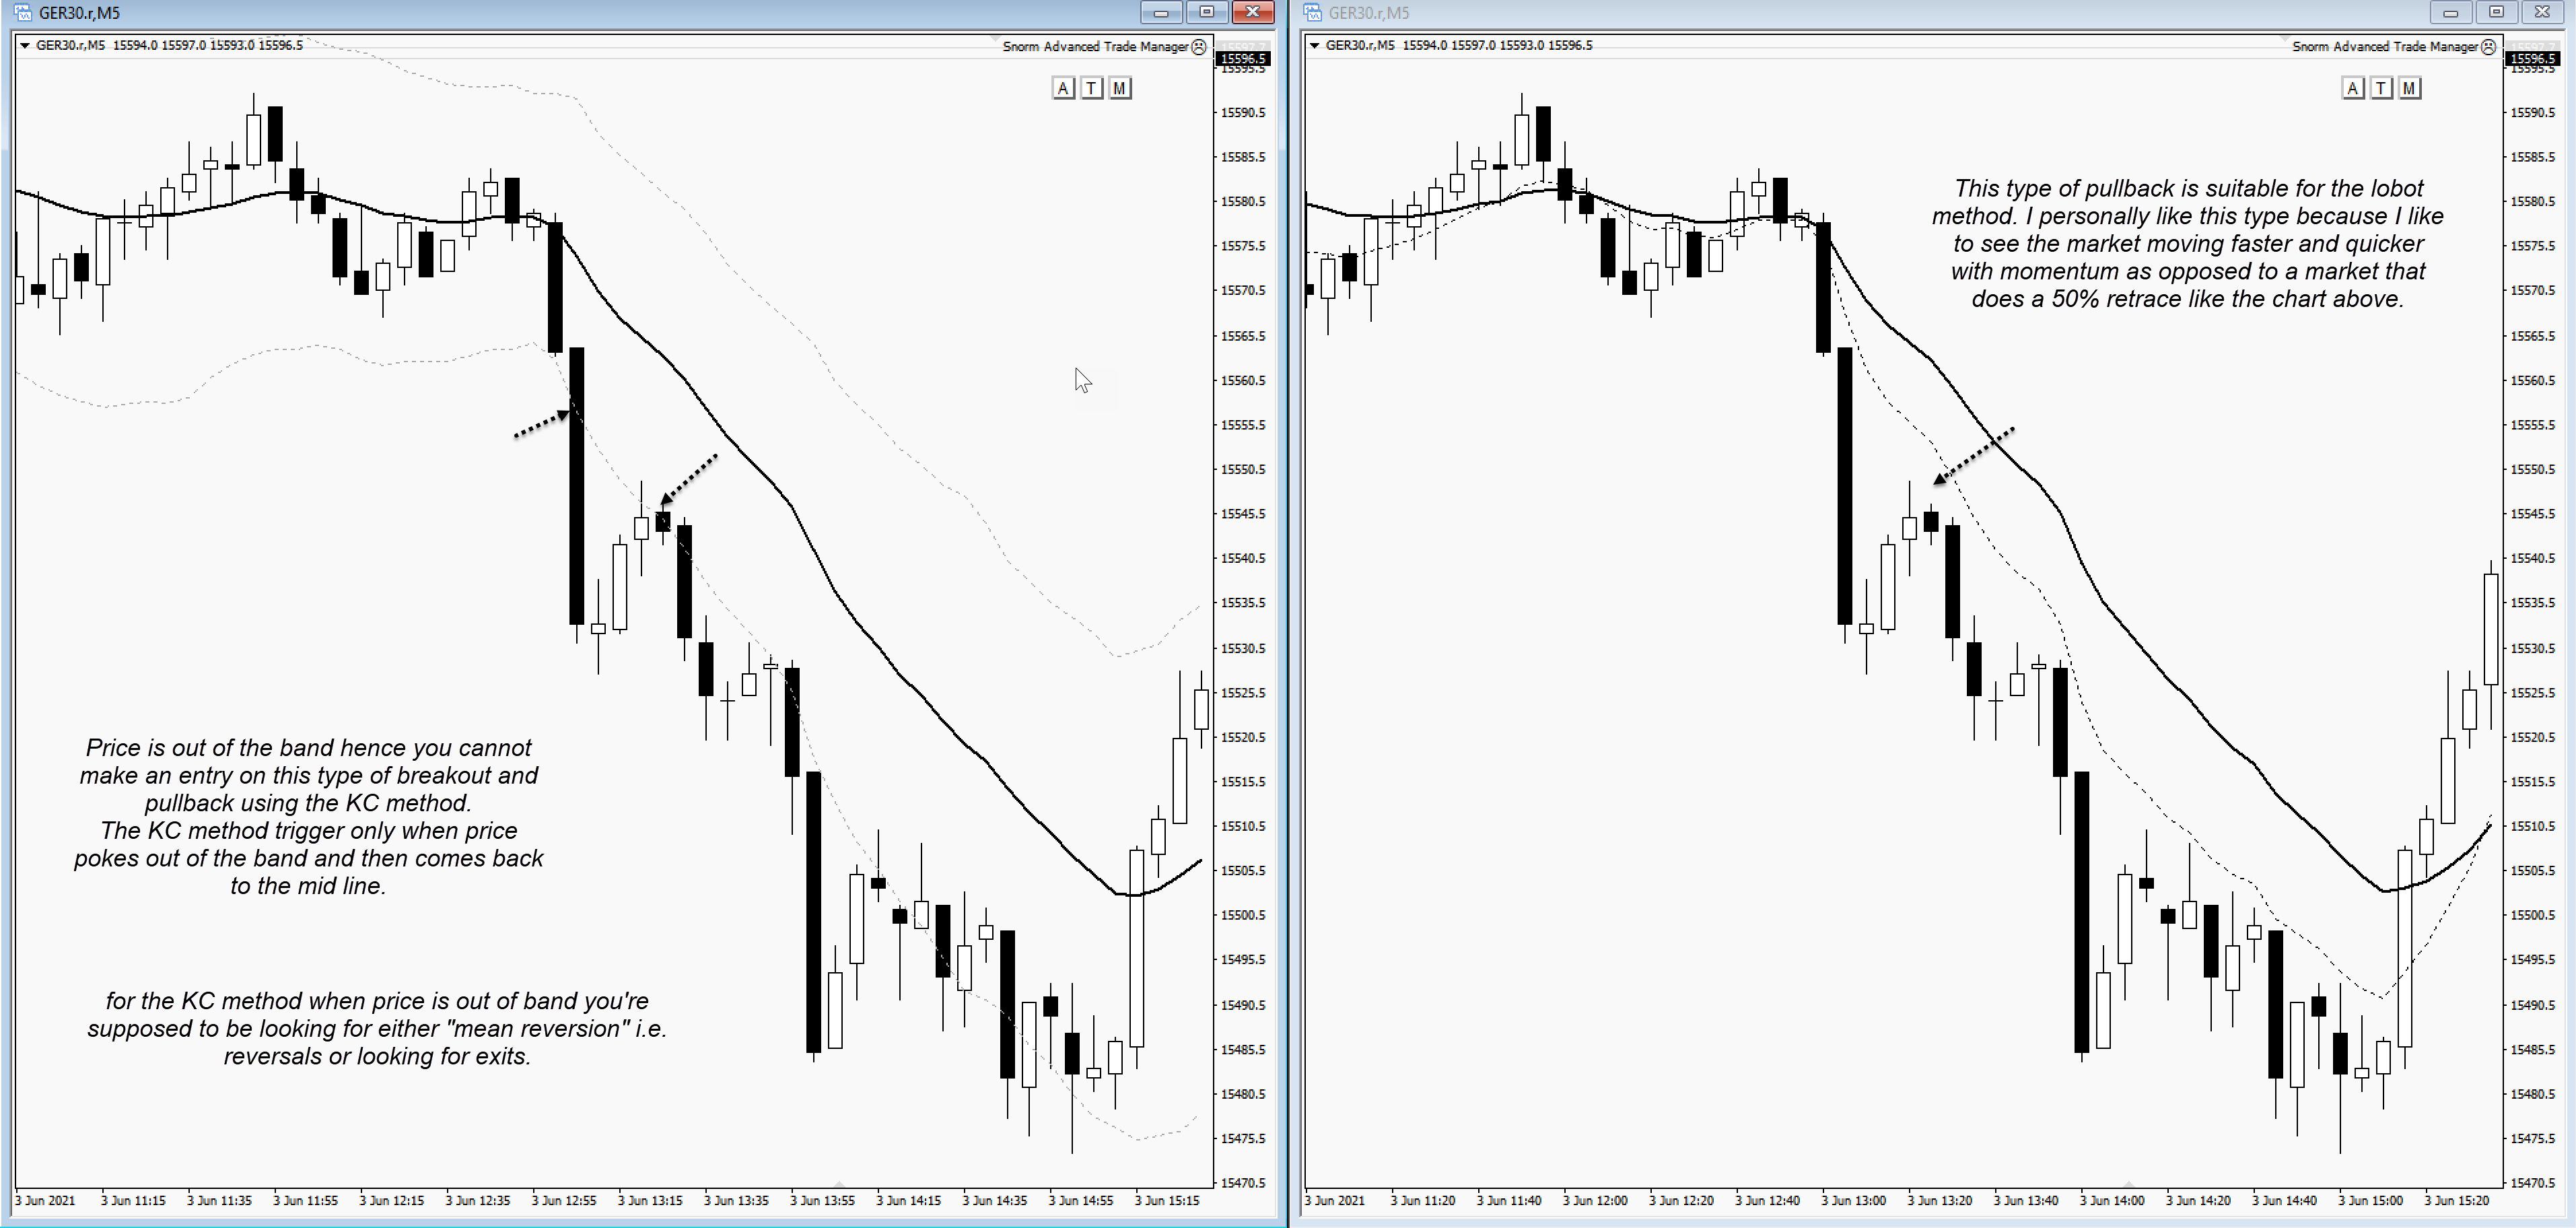
Chart 3:
After the above some more thoughts occured to me. Since market is not really moving today, I have plenty of time on my hands.
What better way to spend my free time than to spend it on charts? analysing it and coming up with ideas Right?
So, here we have chart 3. I show a chart from the 24th of may this year. This is a DAX30 chart again, from NY open.
Let’s look at it from day trading perspective. Since we trade near the open. Here is a chart during new York open. I just randomly selected it.
What you see in the chart comparison below favours the 10/20 lobot method. It appears to me that during breakout situations, the KC can’t capture the moves.
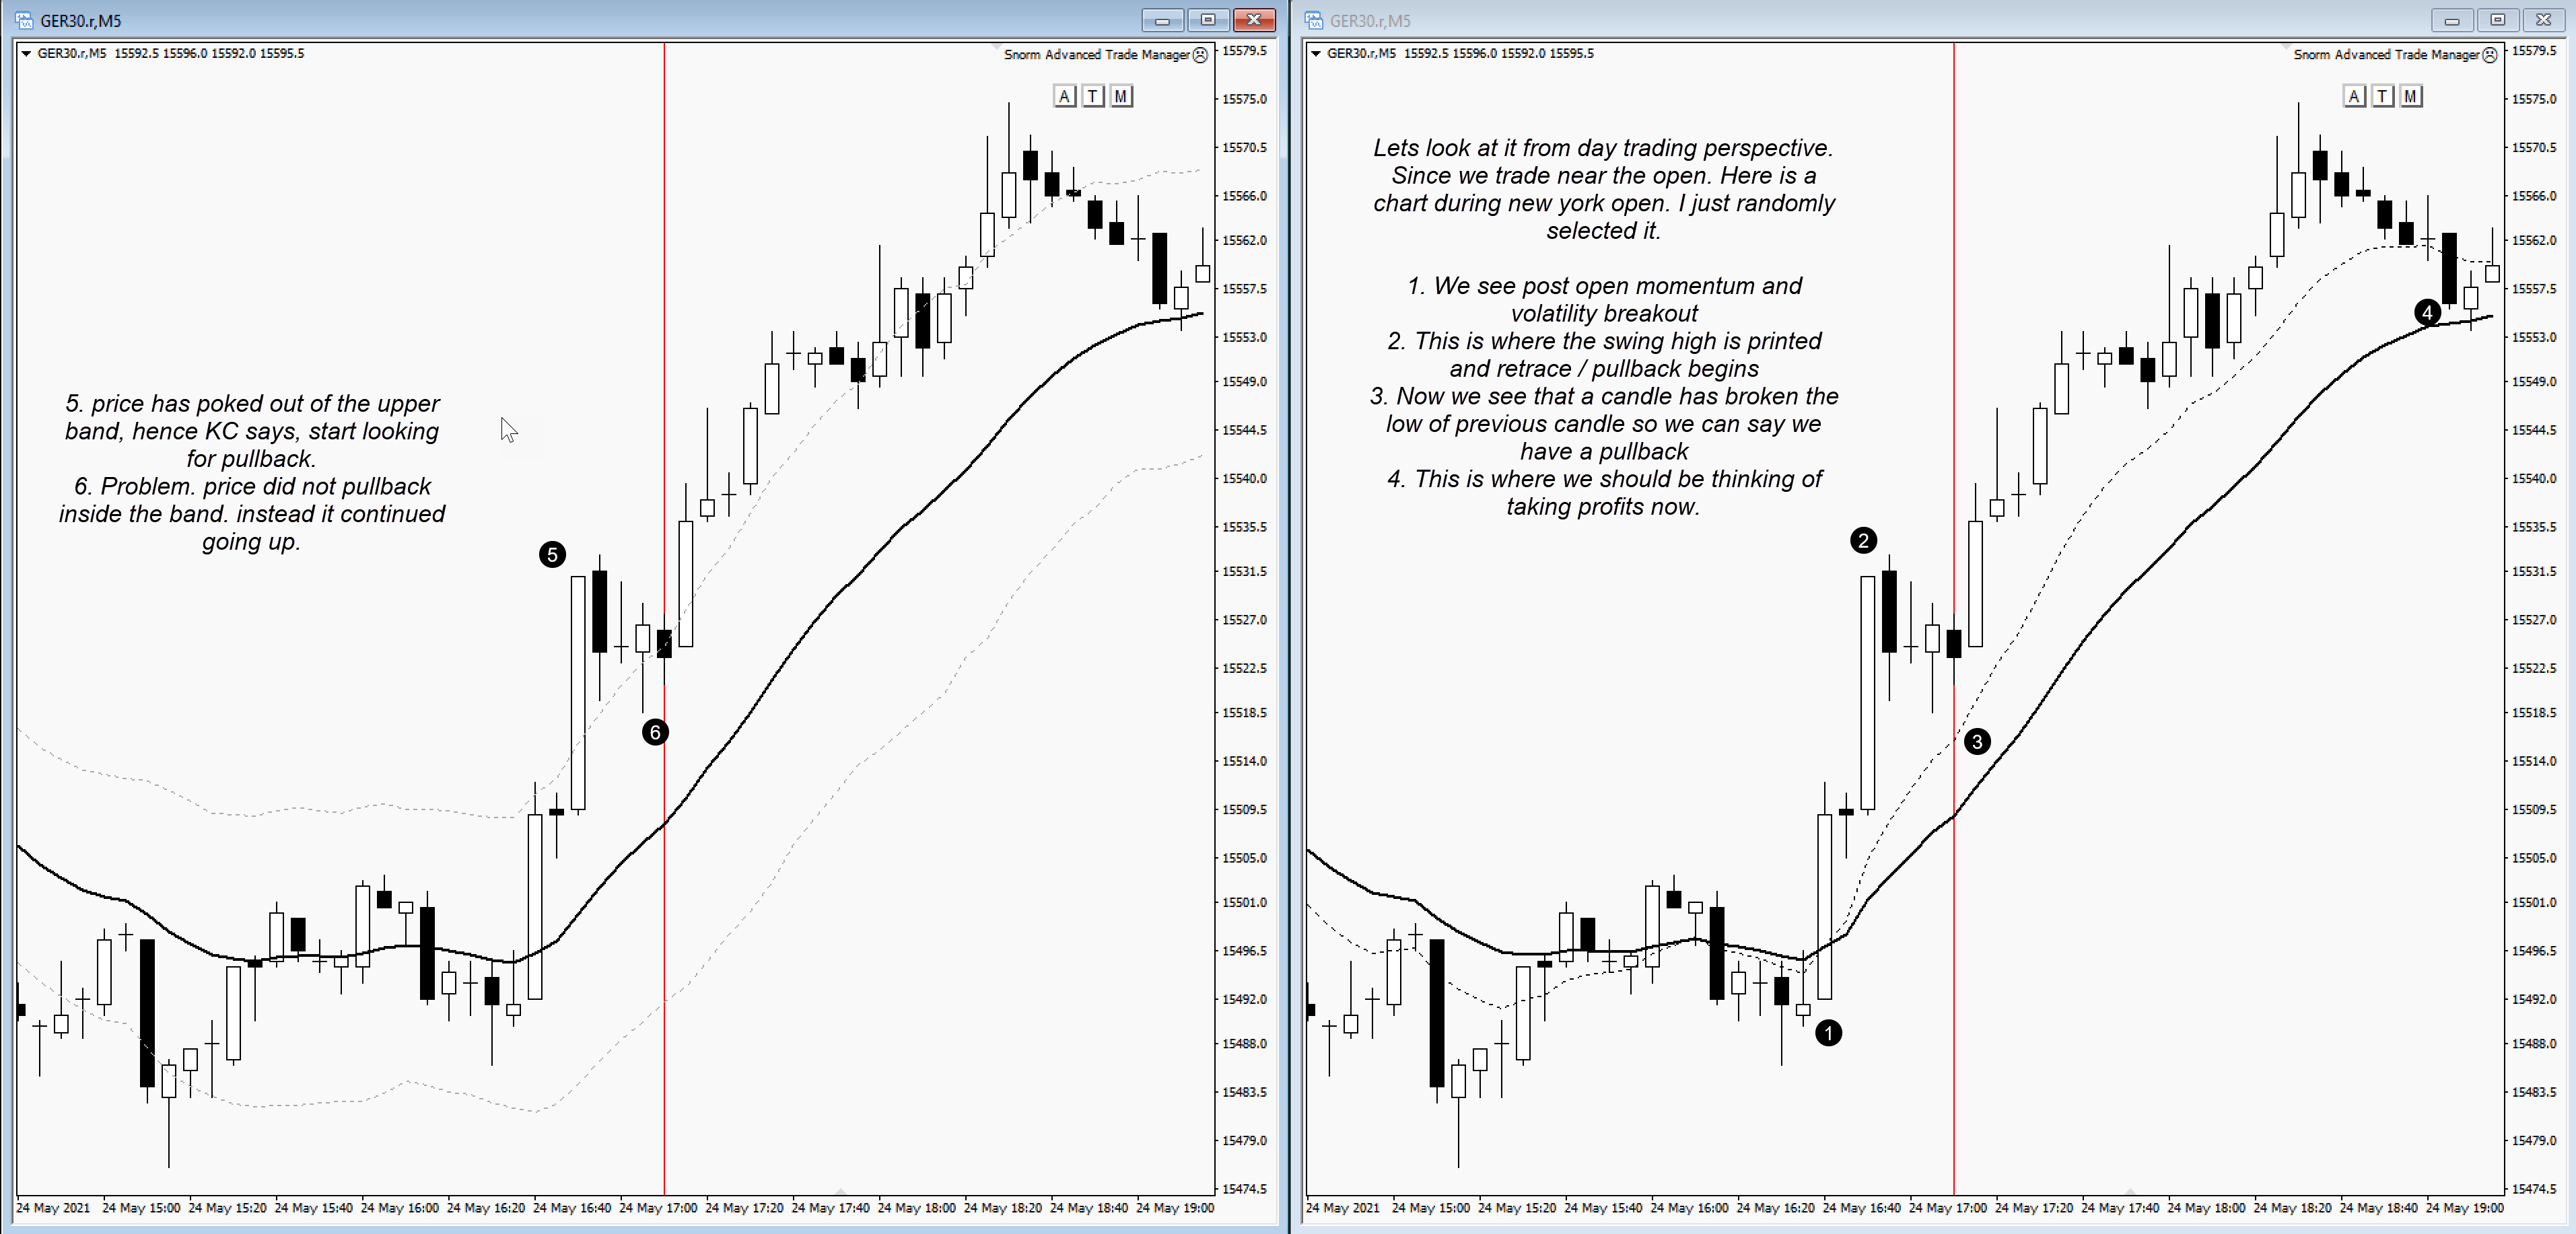
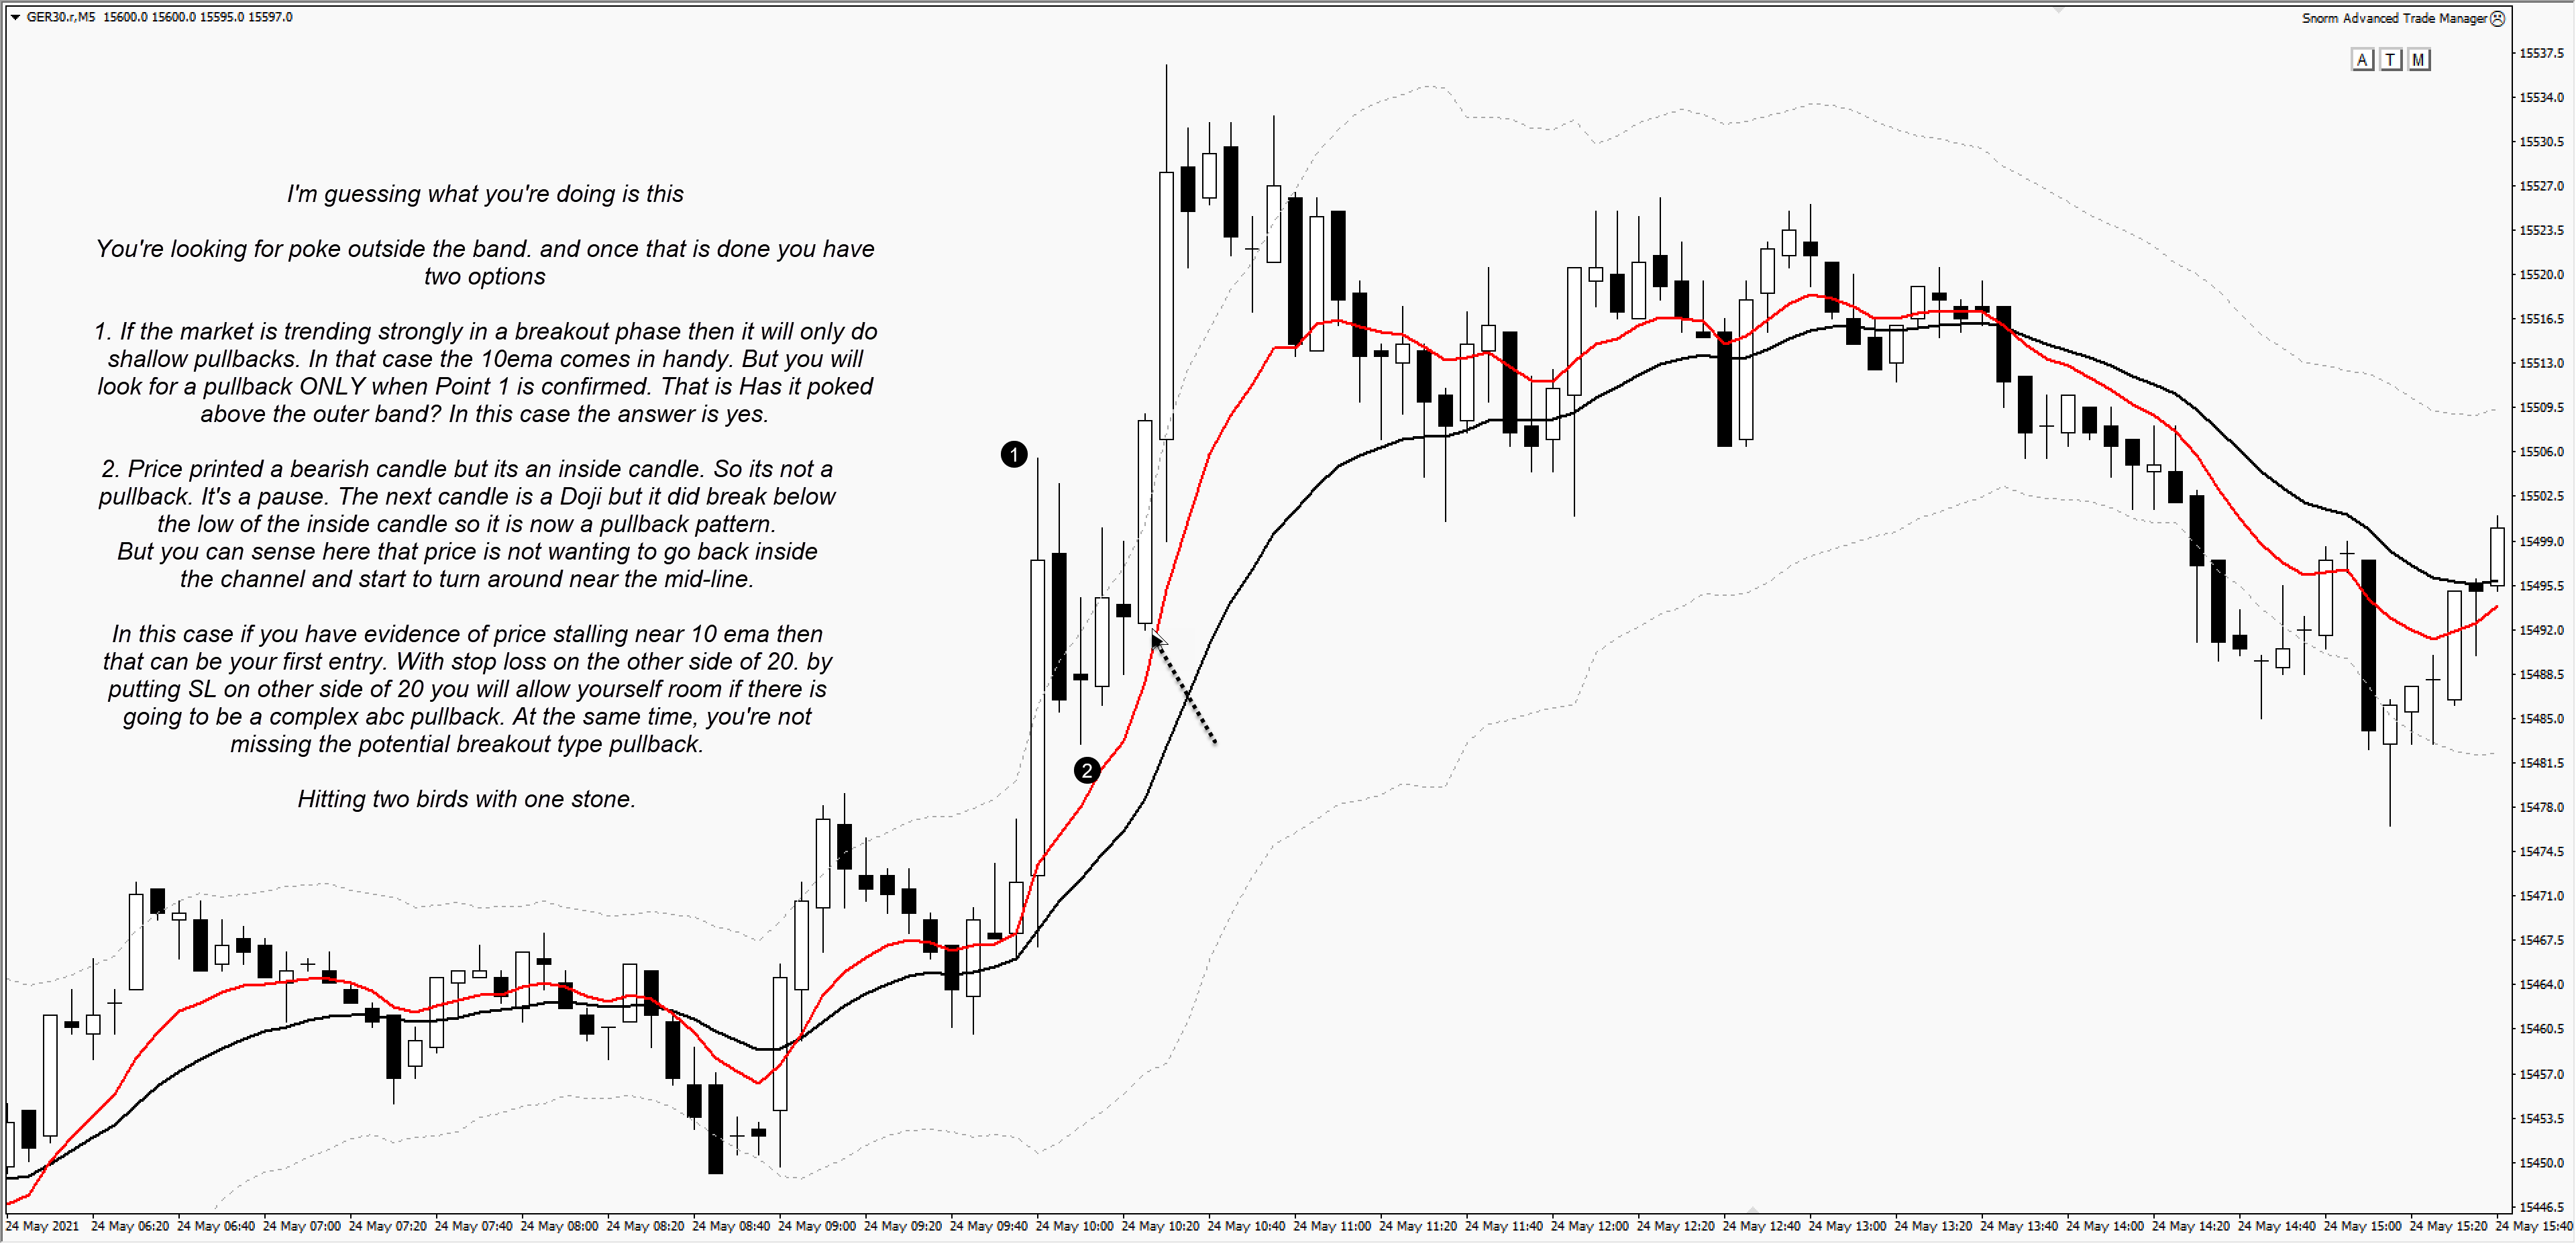
Chart 4 – Killing Two Birds with One Stone
I’m guessing what you’re doing something very clever. Confirm please if my guess was correct.
You’re looking for poke outside the band. and once that is done you have two options
1. If the market is trending strongly in a breakout phase then it will only do shallow pullbacks. In that case the 10ema comes in handy. But you will look for a pullback ONLY when Point 1 is confirmed. That is Has it poked above the outer band? In this case the answer is yes.
2. Price printed a bearish candle but its an inside candle. So its not a pullback. It’s a pause. The next candle is a Doji but it did break below the low of the inside candle so it is now a pullback pattern.
But you can sense here that price is not wanting to go back inside the channel and start to turn around near the mid-line.
In this case if you have evidence of price stalling near 10 ema then that can be your first entry. With stop loss on the other side of 20. by putting SL on other side of 20 you will allow yourself room if there is going to be a complex abc pullback. At the same time, you’re not missing the potential breakout type pullback.
Hitting two birds with one stone.
1 thought on “Trading Pullbacks with Keltner Channels vs LOBOT method”
Hey @sam what do you think?