Faster vs Slower Time Frames
Faster vs Slower Time Frames
Trading on Faster time frames such as M1 and M5 is our favourite trading style . Some might call it scalping but I beg to disagree. There are several trading styles such as Scalping, Day Trading, Swing Trading, and position trading etc.
On our favourite trading platform i.e. MT4 M1 is the shortest or the fastest time frame available for trading. This then is the shortest term trading style available to all MT4 users. However, you can use other tools to create the 5 or 10 seconds charts as well. I have explained this in one of the lessons later in the course.
A scalper may make trades that are active for the least amount of time, but in all other respects scalping is no different from the other trading styles. Our M1 strategy is also no different.
One of the perceived differences between M1/M5 and the longer term trading styles is the amount of time between trades. Trading M1/M5 is often and incorrectly assumed to make many trades very quickly, but the reality is that scalping often requires waiting just as long as H1 Trading, sometimes as long as swing trading, and theoretically even as long as position trading.
The Myth About Trading on the One Minute Time Frame
One of the reasons that new traders are often attracted to M1/M5 is the popular belief that trading on faster time frames means many small trades in rapid succession, with very little time spent without an active trade. As a result, many new traders approach it with an expectation of making a lot of trades very quickly not to mention the expectation of making a lot of profit very quickly, and consequently, they perform their trading incorrectly.
Our M1/M5 strategy is the shortest term trading style, and therefore does tend to make smaller trades (i.e. trades with smaller targets and stop losses), but the frequency of the trades does not necessarily increase accordingly. Yes, this concept is very important to understand. We Trade only when the market conditions are right for trading and that we know by following our Strategy Rules and Guidelines.
Trading M1 Requires Patience
Trading our M1/M5 strategy therefore requires a lot more patience than many new traders expect or are prepared for. It definitely requires as much patience as Trading M5 or M15, sometimes requires as much patience as Trading H1/H4, and in theory could require as much patience as position trading (i.e. waiting Days for the next trade). Professional traders will wait as long as necessary for their next trade, even if that means waiting several days for a trade that then lasts only five minutes.
Shorter Time Frames vs Higher Time Frames
If you have a large account, you might be able to earn good living using time frames that require little chart time, e.g. the daily charts would require just 15 minutes of trading per day. The 4hr time frame would require that you check your charts at most every 4 hrs. or just once or twice per day. If you trade of the Daily Chart, (end of day) you cannot do anything until the next bar is printed so you’ll have to wait until the next day (or close of the daily candle) to take a decision.
Likewise for H4 it would take four hours for the candle to close before you can make a decision, giving you ample time in between. For anything less than M30 you need to stay focused and remain at your computer for a good amount of time. Don’t worry though, we have made this very simple and stress free.
Risk Less – Make More
Would you like to risk less but still make more than you risked? Trading higher time frames require relatively large accounts. However you can still trade the Daily and Hourly charts with as low as $5,000 account. But these days, you can get yourself $200,000 funded account and trade for a prop firm. Money is made with money. If you can start with $200K then why spend your life on a small 5K account?
If your account is too small and want to trade Daily charts you may end up taking trades with 3-5% risk per trade, which increases your return per trade but it means you have a higher risk of losing your account faster, if things are not going your way for a certain period of time.
Alternatively you can enter the time machine, come in to the world of M5 and M1; speed up your life. Let me give you a comparison: if anything above M5 is the atomic world, M1 is just like the sub-atomic world. Let’s tap in to the Quantum Field of M1 trading. Joking apart, the time frame choice has a lot to day with your personality and lifestyle. No matter how much love the one minute time frame, if you work full time during those hours, you won't be able to trade on that time frame. In general, there are more winning traders on the higher time frames than on the faster lower time frames. Period. I speak from my experience of trading with and coaching traders for the last 10+ years.
RISK to REWARD Ratio
In trading it is all about risk to reward ratio. If you can catch 2-3 trades with a 1:3 (risk to reward ratio) on a given time frame per week, you will make a very good living off trading.
You may do that on the Swing Time Frames or you may do this on the Day Trading time frames. It's all up to you and how you like to trade. Let's have a look at a couple of chart examples.
In the picture below, a buy (long) trade was taken on daily time frame. It took 25 working days from entry to exit. Using a stop loss of 300 pips while risking 1% of your account, you would have netted 2.66% on this trade - a good risk-reward ratio indeed, don’t you think?
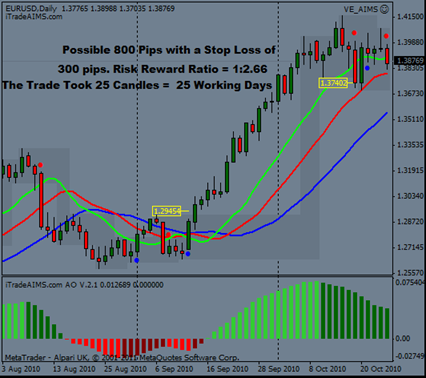
Comparatively, if you took a trade using our Setup on M1, using stop loss and position sizing accordingly, risking no more than 1% of your account it might, give you 1:1 to 1:10 account growth (or more using advanced techniques). The only difference is that the daily trade would take a few weeks, whereas the M1 trade would take just a few minutes.

In the picture above, a similar kind of trade was taken, only this time it is a sell (short) trade on a much smaller/faster time frame - the one-minute chart. The trade took roughly the same number of candles but in a fraction of the time, just 23 candles meaning only 23minutes.
What’s interesting is that you would have still grown your account by 2.66%, similar to the daily trade example, only this time it would have taken you less than half an hour. To raise your account the same percentage growth wise this is significantly quicker as compared to 25 days in the example above.
So,
Would you like to Significantly Grow your account within 3 years or 3 months?
Would you like to take advantage of trading 1440 candles daily or 148 candles yearly?
What would you like to do? The Choice is yours!