Charts Layout in MT4
Chart Layout in your MT4 Platform
We like to use the 2 chart layout when day trading.
Option 1 – M5 to the Left; M1 to the Right
We display M5 and M1 together charts at the same time. You can either use two screens or just arrange windows vertically using a single screen. I used to have a separate screen for each time frame on my trading desk but that changed especially when using a laptop I split the screen, of my MT4 platform, in to two using the ‘arrange windows vertically’, option as shown in the screenshot below.
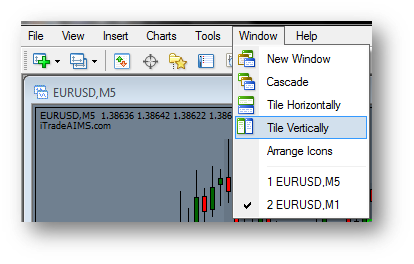
For this option to work, make sure you have only 2 charts open, both of the same pairs and switch one time frame to M5 and another to M1. If you have more than 2 charts open on same or different pairs then this option may not work.
I prefer trading off two charts, though you need not display two charts for trading M5 and above. I look at both M5 and M1 simultaneously because I can: -
- See trend direction at a glance by looking at M5.
- Time an early entry before M5 entry is ready.
- Time my exits far better than exits on M5.
- Minimise my initial risk considerably.
- Count Waves on M1 for a Wave on M5
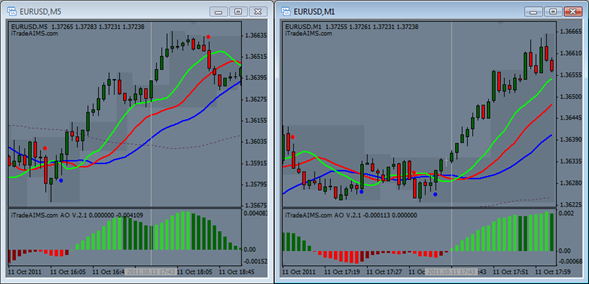
Below is how I see EUR/USD on my screen, with M5 to the left and M1 to right using ‘Tile Vertically’ option as shown above.
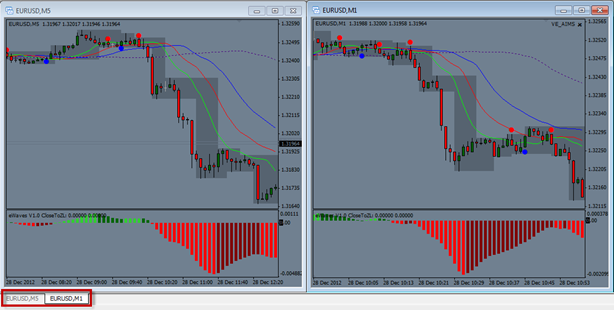
Below: The two vertical lines point to a situation in time where the market created an entry to sell on the M1 chart. By looking at the vertical line to the left, you can see how the chart looked at that particular moment on M5. Notice how M5 showed a down-trend and M1 had a clear short entry Setup. The entry was objectively clear. M1 (right) is an expanded/zoomed view of the M5 (left) chart.
The essence of AIMS Stress Free Trading Strategy is to understand this relationship of Current Time Frame and 5 Times Higher Time Frame.
Option 2 – Only M5 or only M1 Chart
I understand that trading off two charts may not be everybody’s cup of tea. Wide screen monitors are usually able to display up to 180 candles on one screen. This equates to 3 hours of trading data which should be more than enough data for making informed trading decisions.
AIMS Entry Alert, with its special trend filter will alert you to breakout trading opportunities in the direction of the higher time frame trends.
Moreover, The AIMS Gator Indicator with its “No Trade Zone” (the purple line) can be used to have idea of the higher time frame trend and hence help eliminate the need for displaying two charts simultaneously, allowing you to display all the information on a single screen/window.
AIMS Gator can show us the trend of the 5 times higher time frame on our open chart without switching to the higher time frame. The whole idea is to trade in the direction of trend on the higher time frame.