There are many patterns in the market that repeat itself time and again. If you find a pattern that is predictable and trade-able you’ve got yourself an edge. Now the next thing to do is use correct money management and you’ve got yourself a strategy to extract profits from the markets.
One such pattern we found is what we The Scooby Pattern. I know, I know… It looks like profile of Scooby Doo… and it often tells us something. It marks the end of a wave, the middle of wave and even the start of the next wave. In conjunction with AIMS indicators this pattern alone can help one get rid of a J.O.B.
See if you can spot a scooby in this chart… 🙂 [hint: we call this one Inverted Scooby]
 |
| Scooby Doo marking the mid point of wave 3 and allowing you to get into the next wave 5 |
And utilize the power of our Target Zone … #TZ1 #TargetZone #TZ2. We spotted the possible end of wave 5 using this tool. Check the next picture taken few minutes after the above picture. Its pulled off exactly where we “predicted” it.
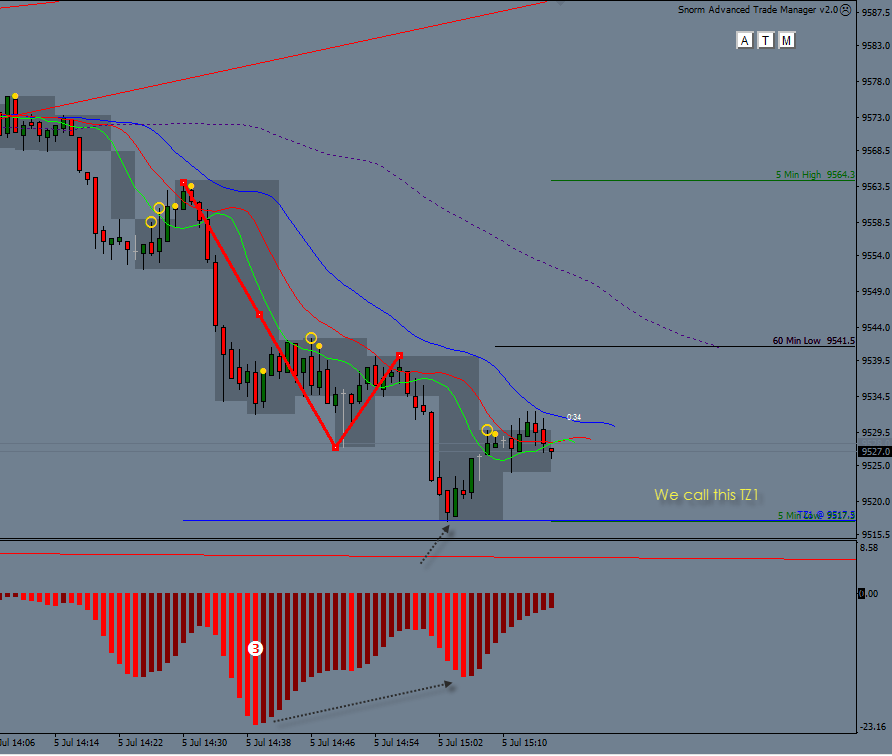 |
| The Power of Target Zone 1. 80% of the time it will hit this line. We BELIEVE in this because we have DATA of Live trading that proves it to us and we take trades with confidence knowing we are going into TZ1. |
one more example
 |
| Can you see the inverted scooby on the chart? |
Join AIMS Live Trading Room to Learn about this pattern and many more.
AIMS Stress Free Trading – http://www.iTradeAIMS.com