Trends and Trading Ranges
What is the Trend and How to Identify the Trend?
The Setup Strategy is a Trend following strategy. The entry types used are Breakouts but we only take breakout traders in the direction of the current trend.
Let’s suppose you look at a chart and you don’t know which way to trade. What you’re saying is that you don’t know what the trend is? How do you answer this question?
Do you look for a certain indicator to be above or below a certain level to establish what is the trend or do you use intuition and Mark 1 Eyeball indicator to establish the trend?
Momentum Trading for Day Trading:
As a trend following trader you must always be aware of the trend. You must always know whether there is an up trend in place, a down trend going on or is the market in a tight trading range going sideways.
For momentum trading , before we know what is the trend we need to ask another question. Is the market moving? Do you look at an indicator to tell you whether it’s moving or you just look the price chart and use your common sense to establish if the market is moving or not? This comes with a bit of chart watching experience.
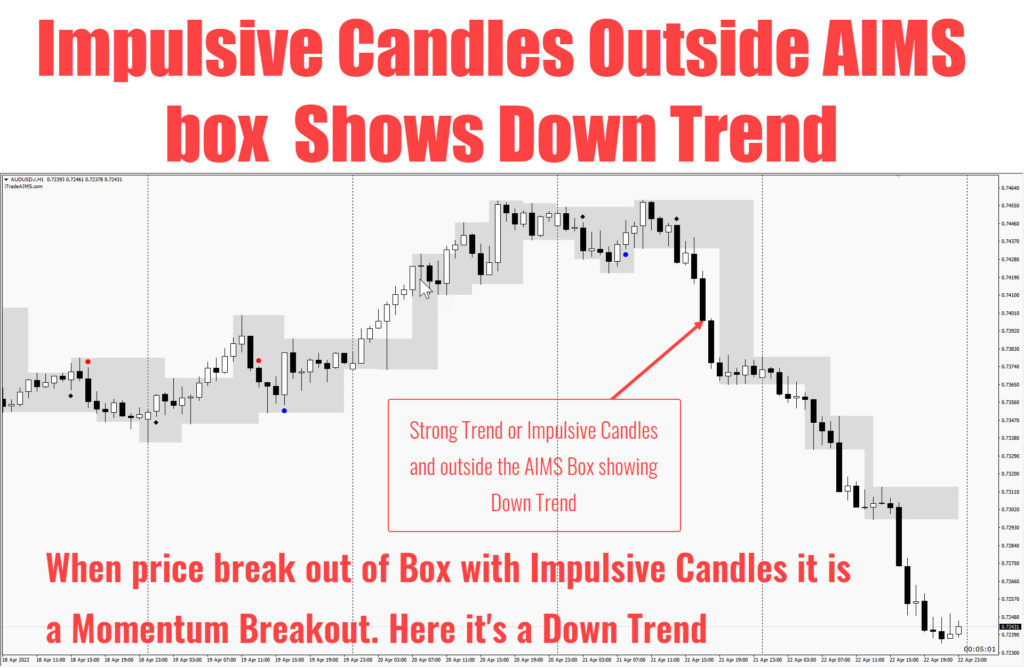
When the Market starts moving constantly in one direction and continues that way we can say that there is a trend. The Trend may be upwards or downwards. When the market is not constantly moving in one direction, on a certain time frame, it may be moving back and forth between a certain range.
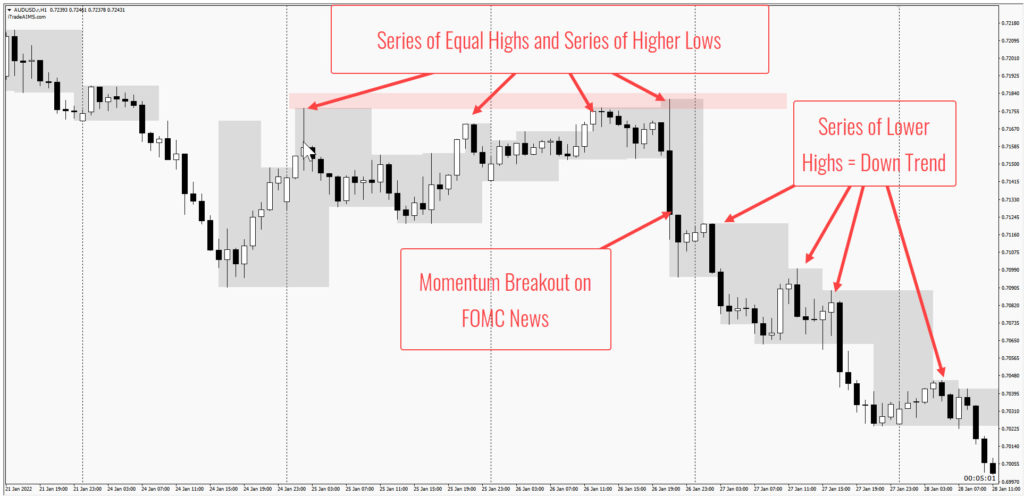
A trading range has equal highs and equal lows. A trend has higher highs and higher lows within up trends and lower lows and lower highs within down trends. When there are 2 or more equal swing highs and 2 or more equal swing lows then we can say its a trading range. Under such circumstances, we can say that there is no trend. Now let’s see what a trend is
The Dictionary definition of a Trend: A general direction in which something tends to move. Note that it is the Direction of the Movement. Like Einstein said, “Nothing happens until something moves,” When market does not move, nothing really happens, and in terms of your trading, nothing should happen, until something moves.
That something is the market, and by that we mean the price. Now you can argue that price always moves. Yes it does. But we are interested in a move that shows a certain “Trend”. We want the moves to be of a certain wave length. E.g. a market might move in one direction for 10pips or it may move over 50 pips. It is the later moves that we are interested in.
So, what is the Trend? may just be the most important question. Is the Trend Up or Down? If it’s not up or not down, or if it was up and then immediately down, then what is the trend? The answer is, if it’s neither up nor down, then there is no Trend.
Meaning nothing is happening. This is an important point to understand. For a trend following strategy it is absolutely vital to establish the direction of the trend before any trading decision is made.
A Trend following strategy/system does not allow you to trade under such no-trend situations. You would not expect to trade under those circumstances? You will wait for the trend to confirm. But how do you find out whether the Trend is Up or Down?
There are 2 Objective Ways to Identify the Trend
Option 1: Using Some Combination of Indicators:
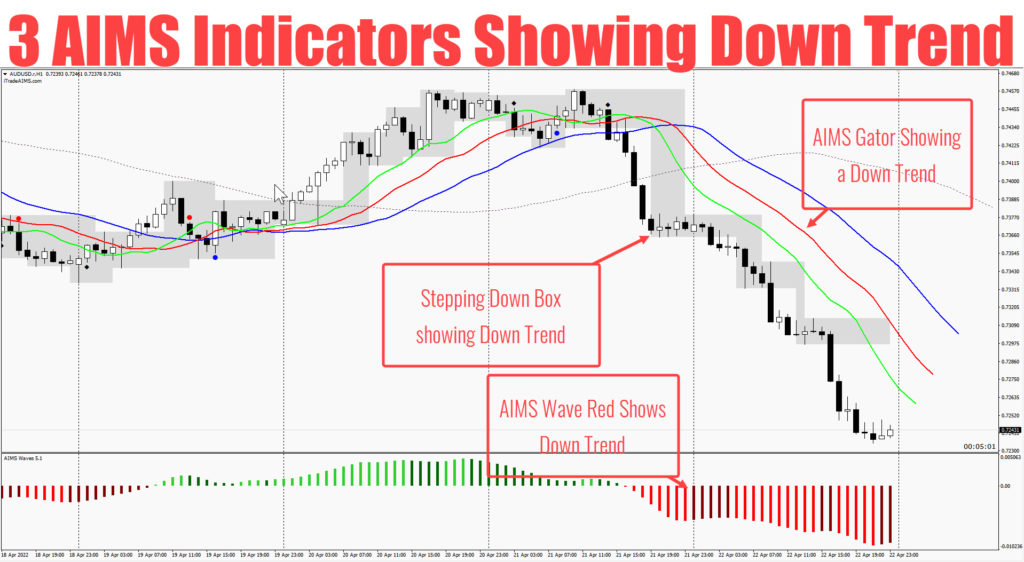
The first option is to use your indicators to tell you what the trend is. The simplest way to define this is to use the AIMS Gator Indictor. When the Gator lines are pointing upwards and the gator lines are above the purple line, the trend is Up. When the gator lines are pointing downwards and the lines are below the purple line, the trend is down. More on this in the lessons that follow.
I suggest you use your intuition and instinct as well, in deciding if the market is moving as required, rather than using just a fixed measurement (e.g. an indicator being above or below a particular level). Intuition and instincts either play an important role in trading, or they play no role at all. This is because they apply differently to discretionary and system trading.
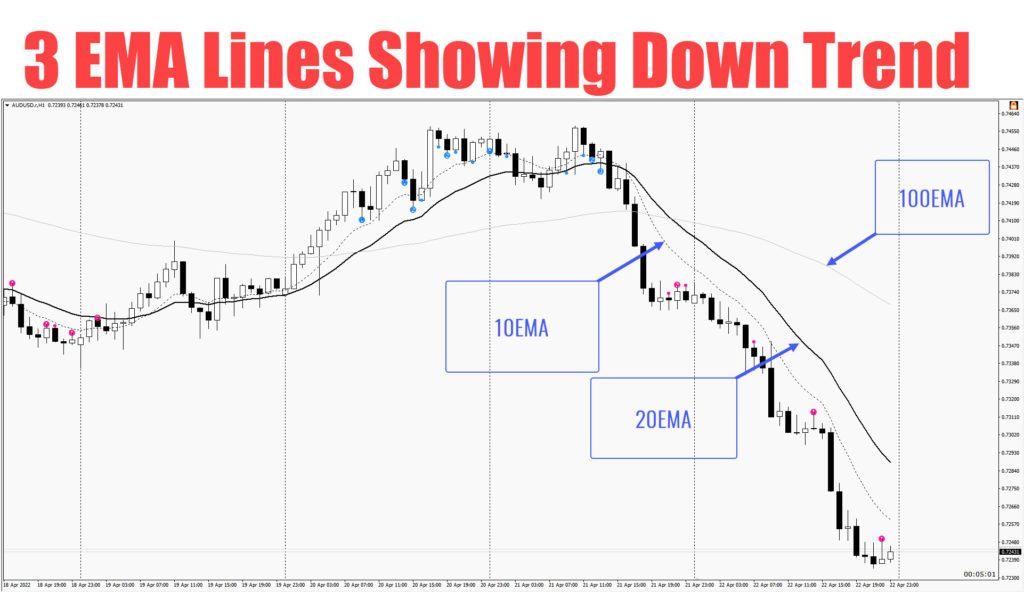
Below: 3 EMA showing Down trend – When the faster ema is below the slower ema and both of these are below the even slower ema it is a down trend
Option 2: Use Price Chart and AIMS Box
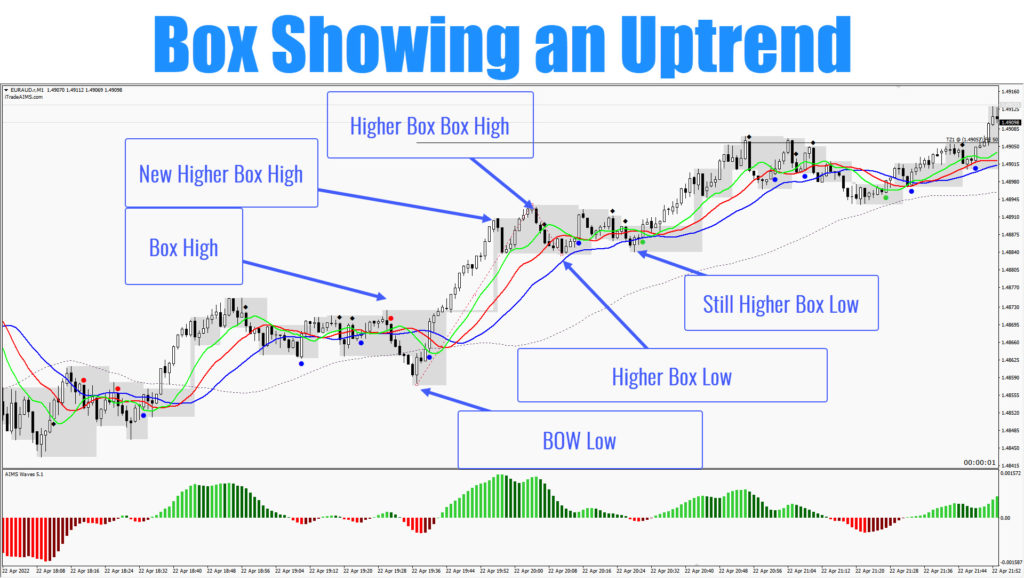
The second way to identify a trend is to use the price chart itself. Look for Swing highs and Lows or AIMS Box levels. When the Box is creating a stepping up pattern the trend is up. When the box is creating stepping down pattern the trend is down. More on this in the next lessons.
