
Ok First, I am EXTREMELY excited about this topic for 2 reasons.
Firstly, I’m excited because this pattern, the pullback pattern, has been properly thoroughly tested and statistically proven to have positive expectancy. The testing is not only ours but in fact, the whole financial trading industry knows about this pattern. This pattern appears and works on all markets whether it’s Forex, Stocks, or Cryptocurrency.
Secondly, I’m excited because we have developed a fully tested and objective MT4 Entry Indicator for this. We call this the BANANA Entry Indicator. Check it out here
What is positive expectancy?
A positive expectancy means that when you average out all the wins and losses you make money. It means if you divide your total profits by your total trades and have a positive outcome on average. Also known as the Profit Factor.
Investopedia
How was I able to test this method?
If you wanted to test if the pullback method works, the first question would be to ask “how can you code this”? How to tell the computer what to look for?
- Do you have to define what is a pullback trade?
- When do you look for a pullback trade?
- How much of a pullback is just the right amount and how much is too much?
- When do you enter a trade?
- When to exit a trade with a profit?
- When to exit a trade with a loss?
- How will you define the entry and exit criteria?
We begin with defining what is a pullback.
We will achieve this by applying a volatility breakout definition which will help us define what is a pullback. Remember we are talking in terms of computer language. We already know what is a pullback because we can simply look at a chart and visually see it. For illustration purpose this is what a pullback looks like:

A Simple Pullback Pattern

A Simple Pullback Chart
While it is important to define and understand a pullback it is more important to learn where pullbacks work the most. The answer is simple: The best pullbacks happen when the market is trending.
We want to trade only the pullbacks that are good pullbacks. For testing purpose we need to come up with parameters to tell the computer how we define a good pullback.
So, the question is What are the Good Pullbacks/ what are the best times to trade a pullback in computer language?
We have found that the best pullback trades are taken when the market is trending. We don’t want to trade pullbacks inside the sideways range-bound markets. So we need to come up with a mechanism to eliminate those.
How do we eliminate sideways markets? And how do we define good trends?
The answer? The Average True Range.
What is ATR?
The average true range is a technical analysis volatility indicator originally developed by J. Welles Wilder, Jr. for commodities. The indicator does not provide an indication of the price trend, simply the degree of price volatility. The average true range is an N-period smoothed moving average of the true range values.
Wikipedia
So, if we can define good pullbacks by using a Volatility Breakout using ATR of the market.
What is Volatility Breakout?
In order to qualify good pullbacks, define trends and eliminate non-trending markets we define a trend breakout by looking at a 2ATR move. This means that when the price moves 2 tiems its ATR (average true range) we can consider this as a trending volatility breakout. This is how we do it.
1. We look for a 2ATR breakout of 20EMA 2. We look for price pullback to the 20ema 3. We take the trade at the touch of 20 4. We set Target at 2ATR and SL at 1ATR
We can achieve this by applying the good old standard indicator called the Keltner Channel.
Keltner channel is a technical analysis indicator showing a central moving average line plus channel lines at a distance above and below. The indicator is named after Chester W. Keltner who described it in his 1960 book How To Make Money in Commodities
Here is what Keltner Channels are made of:
It is simply a moving average with upper and lower bands. The bands represent x multiple of a ATR. The popular moving average is 20ema with 2X ATR. That’s what we have used as well.
Example from a difficult chart to trade. Instead of taking a pretty and easy chart to trade I have chosen a hard one. Below is a chart of DAX on the One minute chart on the 18th of March 2021.
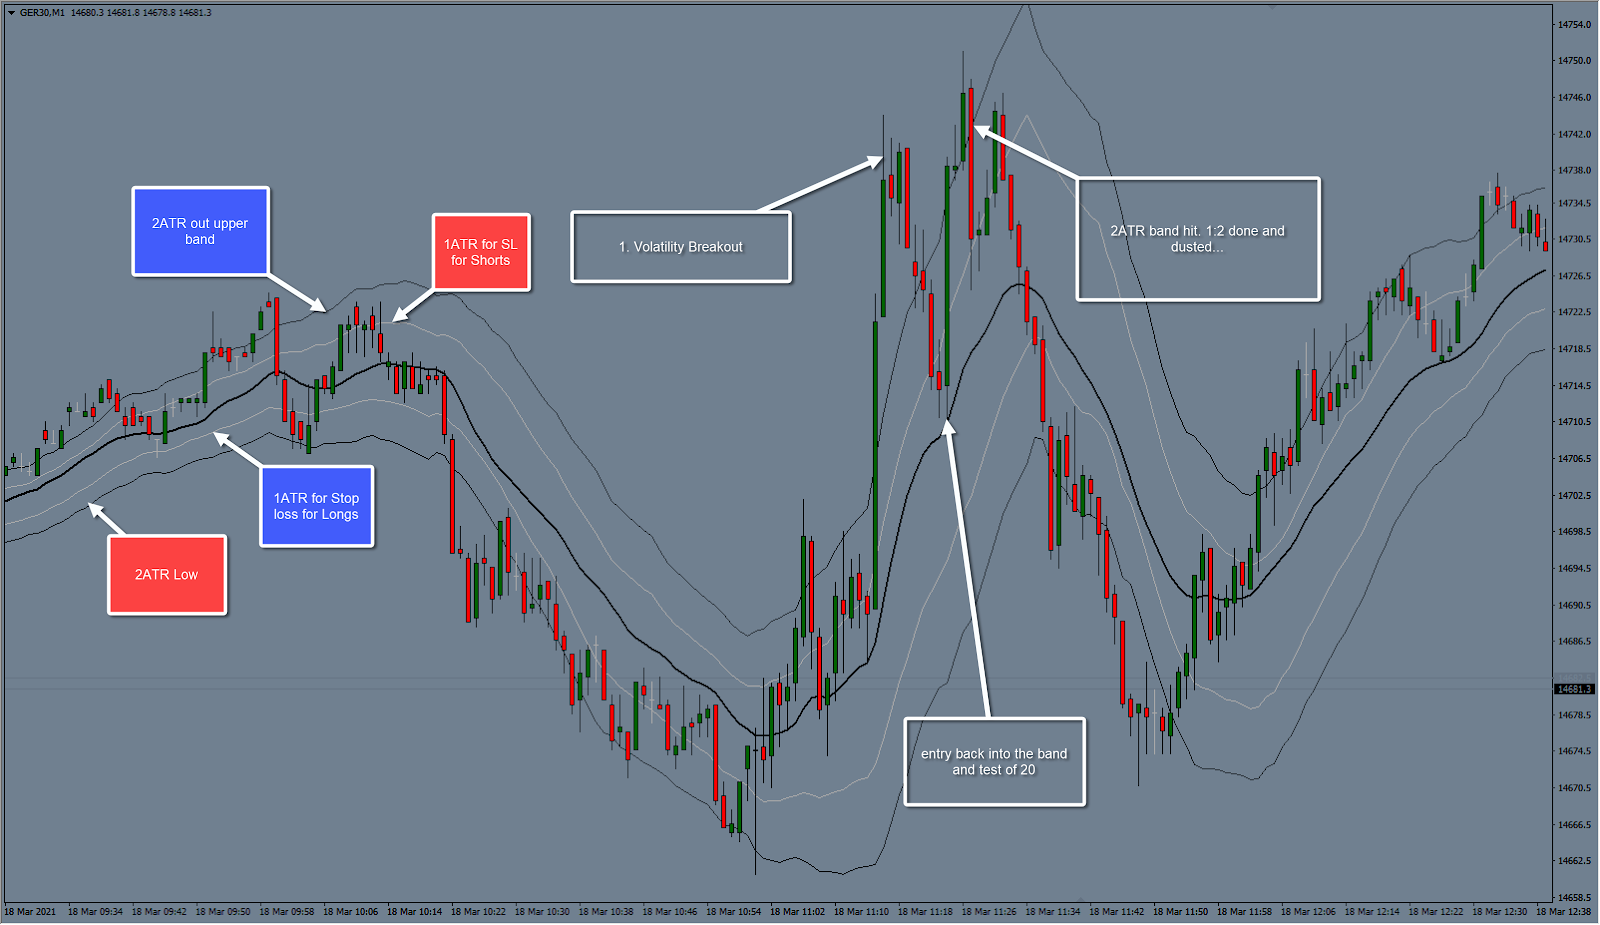
- The middle line is 20ema.
- The upper and lower bands are 2 ATR lines.
Please note that I don’t display my charts like above. However this is simply to show how I tested the method.
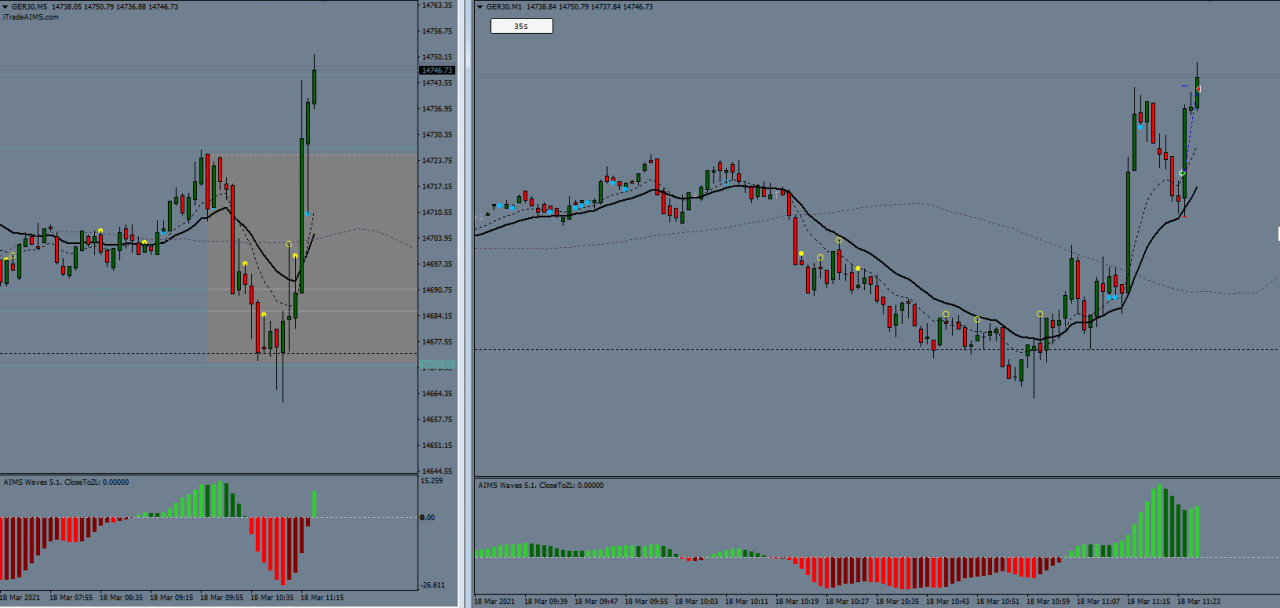
Emma, a member of Discord and AIMS Forum took the above trade using her LOBOT Template.
Models
Statistical models are just that, Models. The models we have tested and use have proven edge with positive expectancy and profit factor.
We are not supposed to or not necessarily have to trade exactly the same way. But when you see that a strategy has an edge, you can then work around that model. You can improve it and make it your own by doing further tests on the base model.
When I presented this idea to Sam he said, “You have years worth of data to back your decisions. Finding edge in trading is like finding goldmine” and then he said

Bless you Sam, thank you so much.
Strategy Testing is Very EASY to Do Now
When we were chatting I was sharing with him how these days anyone can run these tests which used to cost me so much money before.
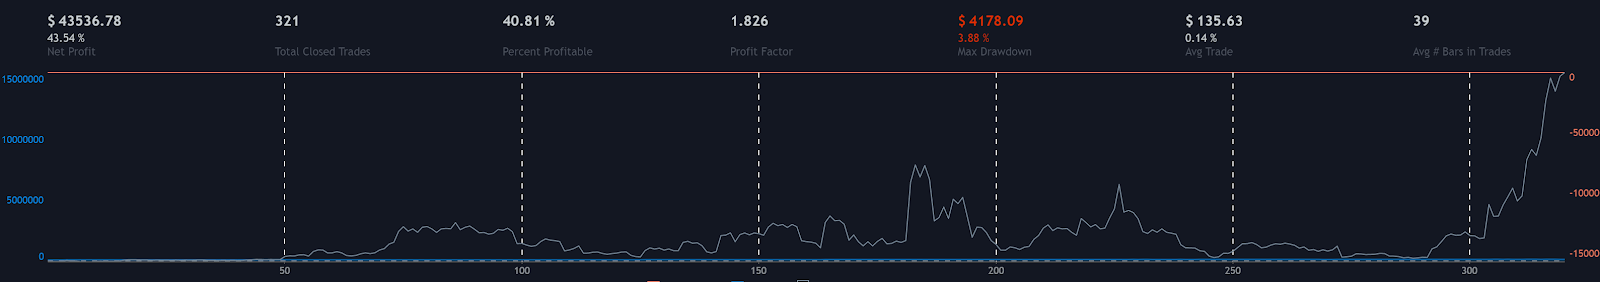
I used the Strategy testing feature of the TradingView platform. It is so simple and easy to use. In the picture below you see some insane results. I have literally used the standard built in strategy test for keltner channels provided by default.
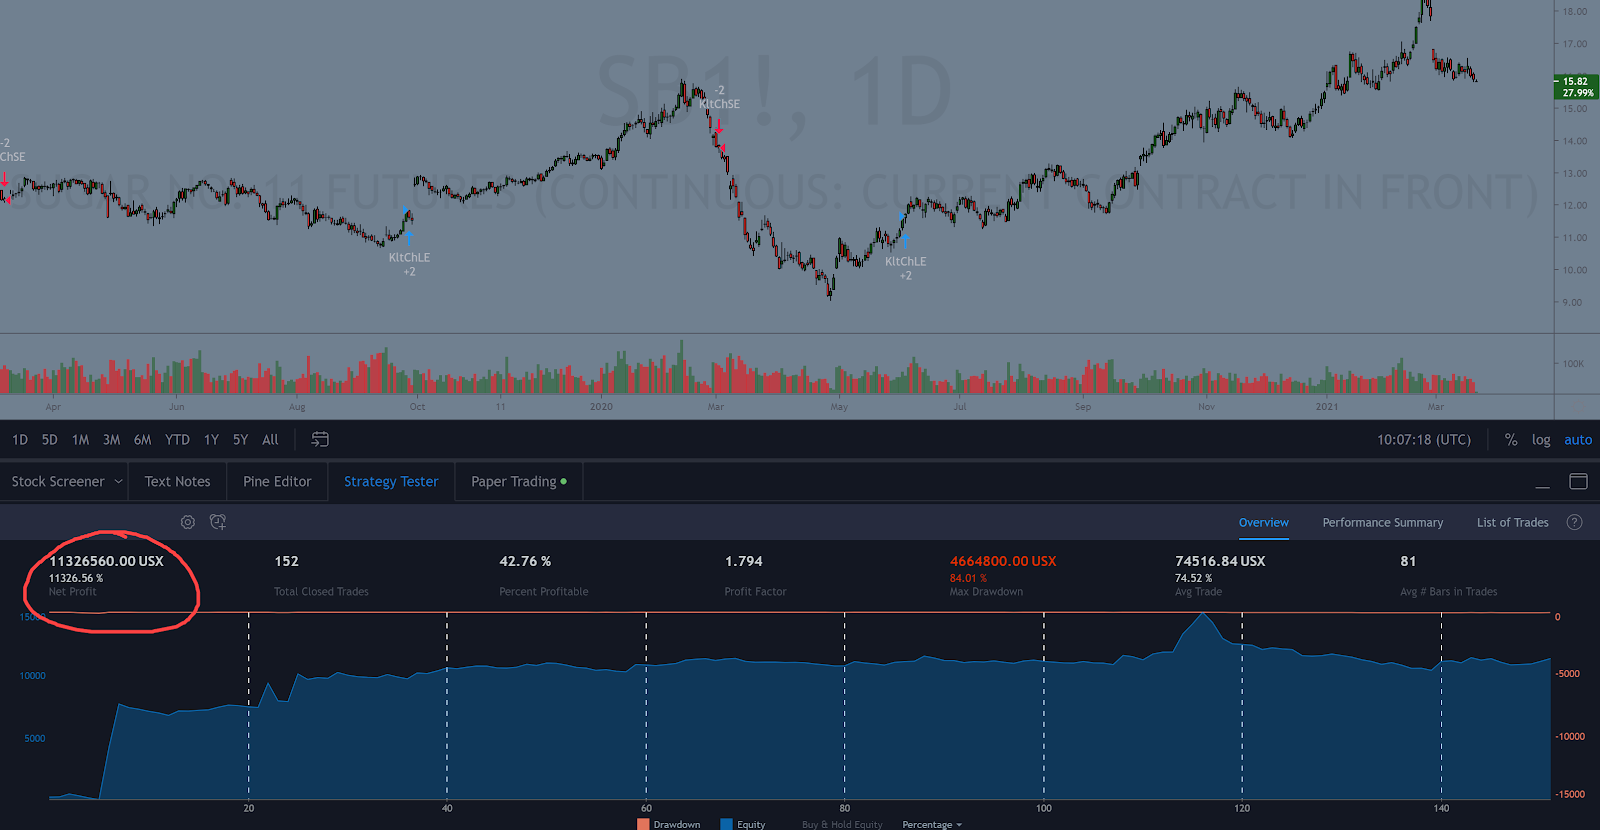
In the picture above you see 11326% account growth and profit factor of 1.7.
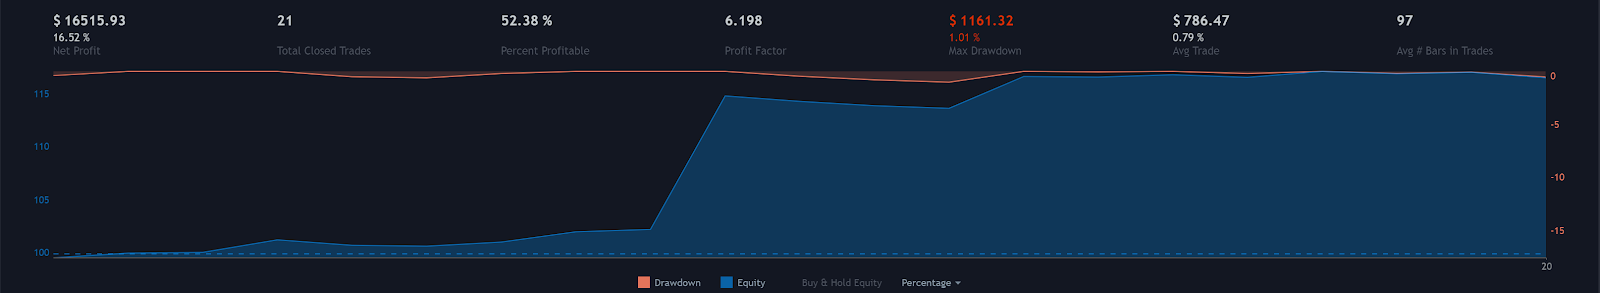
Apple showed 16% growth with profit factor of 6 (wow)
43% Profit / Growth on AMD
And don’t forget this is simply using the standard settings. This can be further improved.
You Must Always Trade with a Strategy that has an Edge
I’m just trying to prove to you that the methods we use and all the methods we have, have solid statistical studies and proof behind it. so USE it to your advantage…
How to Test the Setup 1 Strategy?
There are two ways to test the Setup 1 strategy. The best way is to derived method. Let me explain in simple terms.
The logic here is that because we know that Setup 1 on the current time frame translates in a Pullback pattern of the 5XHTF. (five times higher time frame).
So, now it makes sense, that if you apply the pullback method strategy test to the weekly chart you will AUTOMATICALLY get results for testing the Setup 1 of D1.
That’s another, secondary way, I can claim, the The Setup 1 strategy has a positive proven 1.5 Profit factor and 66% win rate.
Now let’s Study this Chart below
Whenever price Breaks out of the Channel and comes back to the center… on the daily chart….
you will see a setup on the H1 chart on stocks … https://www.tradingview.com/x/xyJUkZzu/
Example from Tesla One Minute Chart 19 March 2021
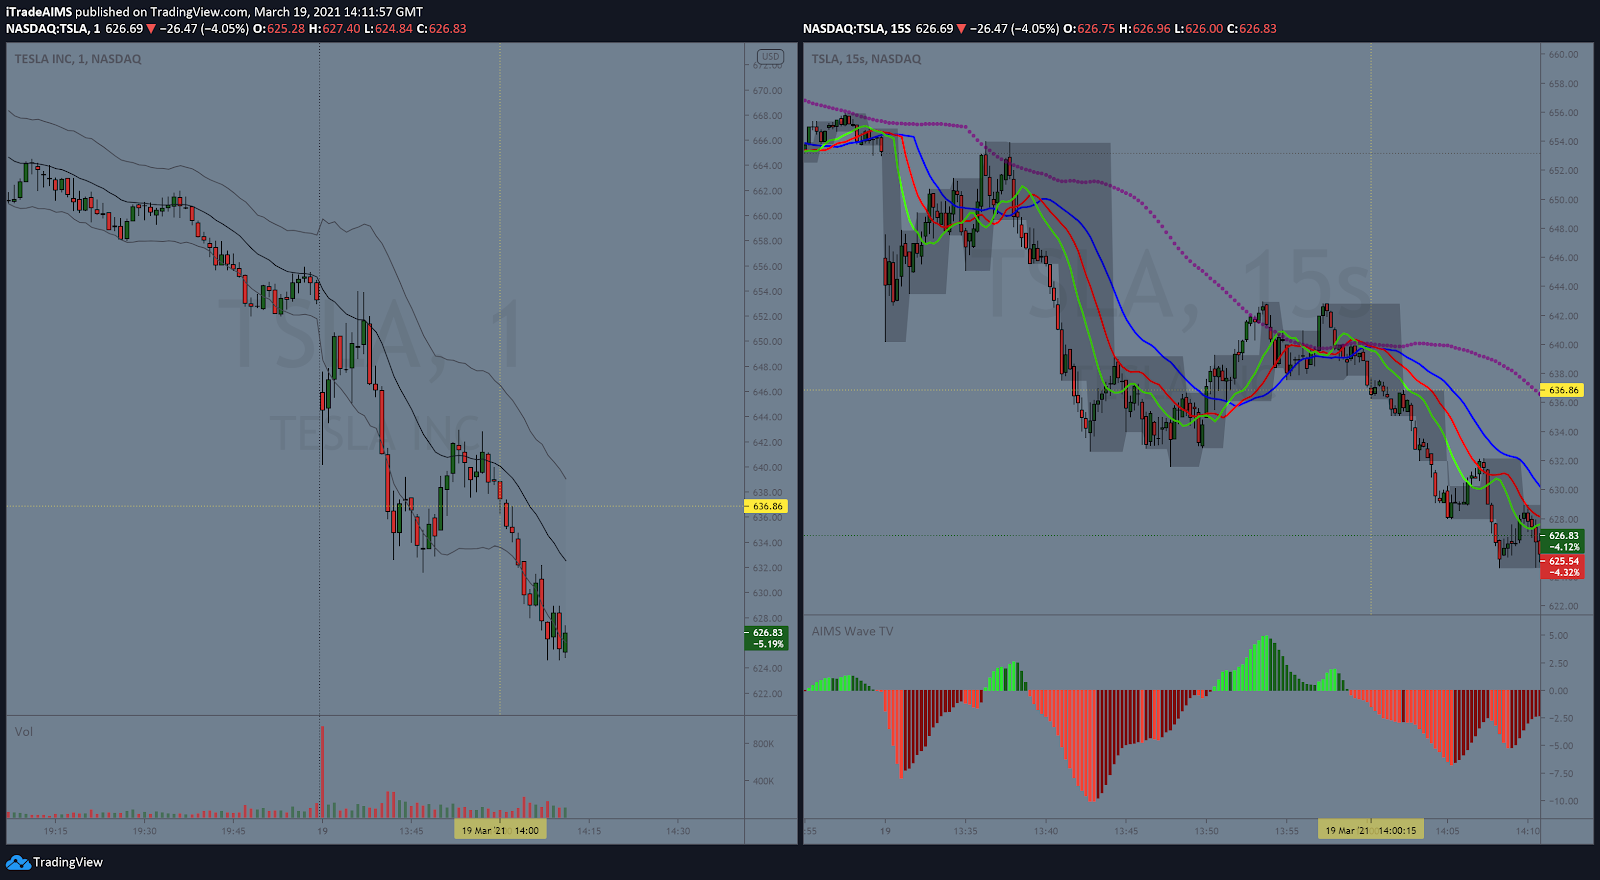
I Traded this one … both on D1 and h1
Can you see that before a setup 1 is created, on the Weekly chart it goes out of the 2ATR band… then comes back to 20ema… meanwhile on D1 it creates a setup 1… which means if you strategy test the BAnd strategy and find posiive edge, you’ve found positive edge on setup 1 as well… without even testing it. (testing setup 1 is REALLY hard becasue it has too many parameters)
The Setup 1 … THE BEST STATISTICALLY PROVEN METHOD
It appears to me that the strictness with Setup 1 is not required…
All we need is hte pullback, the way gator is sleeping and the way box is formed is of less improtance…
Which means … the easiest template should be like this….
Wait for wave 3. wait for wave 4 and trade box break above the purple … like this
https://www.tradingview.com/x/YdtkPaFa/

I have missed so many setups … like this one … because of my VERY strict Rules https://www.tradingview.com/x/5uheOKgr/

again in the pic above you can see that price broke out of the ATR band… (chekc weekly chart) which translated into a wave 3 on the daily chart
then it came back, pulled back to the band center i.e the 20ema, which translated into the Wave 4 on D1 and hence Setup 1 was created….
and BANG BANG…
I regularly upload videos where I explain how I trade. These videos are often reviews and recaps of the same or the previous day. Check out this latest post to learn more about how I define Trend and how I use Trend lines