
The chart you see above in the video is $UNH (UnitedHealth Group Incorporated is an American for-profit managed health care company based in Minnetonka, Minnesota.) I will show you a very Simple Pullback Trading System. It’s simple and very powerful.
I called this trading signal out the other day in our trading group and on my trading view profile. The chart is from the 7th of April. I want you to look at the chart and see how simple this pattern is. The process of finding this setup is very quick and simple. The idea is to run a scanner. And before I run the scanner for you let’s first explore what is the is the idea behind this. The first point we want to know is whether the market is a trending phase or range-bound? We want to wait for the price to break a range, right?
You can see on the chart that it was within a range and inside the channel. When the price inside the range it means you have to wait for it to break out.
How to identify a breakout: It’s Easy
I’m assuming you know how to identify what is a range. A range basically has no sequence of Higher Highs and Lower Lows or a Sequence of Lower Lows and Lower Highs. A range has no sequence of higher highs and higher lows which is the definition of an uptrend and it doesn’t have a sequence of lower lows and lower high which is the definition of a downtrend.
The price tries to break the range, but it doesn’t succeed. Instead, it comes back up breaks the high, and then comes to touch the centerline with a clean pullback pattern, none of these candles have broken the high. The first candle that breaks the high is this one on the 8th of April. Here you buy the stock and get in, otherwise, the next candle has another buy entry. And look where it is now. Entry was $360 it went by to $390 for a nice 10% profit.
It’s gone up you can either take profits here today or close half and let the rest run, its up to you. If you had setup up a 2ATR target then you would have hit your target point and you’re out.
This really is that simple pattern and I have developed a scanner for this. The scanner I use in TradingView.com platofrm can scan charts which lets me pick charts that are about to breakout.
The Process of Picking Stocks: Simple Pullback Trading System
First you wait for the scanner to pick stocks that have create a 3 Month High.
Second you check if its out of the Keltner Channel Upper Band.
Third you wait for price to pull back towards the Keltner Channel Mid Lilne.
And that’s it.
To make entries you can simply use Limit Orders or wait for a Bullish Confirmation Candle.
This is how simple it is and it took me two minutes to explain.
Anthem $ANTM
I did not get a trade on UNH on my IG.com spread betting account. But I got another one, exactly similar setup on Anthem. This Stock has also hit its target point.

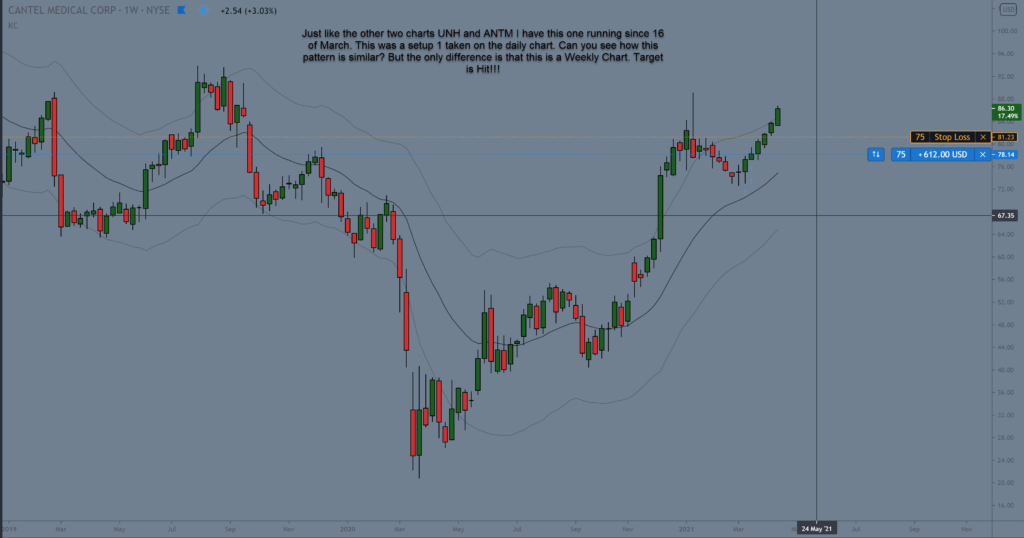
I have a trade running on $CMD since the 16th of March.
Just like the other two charts UNH and ANTM I have this one running since 16 of March.
Another Example is on $CMD
This was a setup 1 taken on the daily chart. Can you see how this pattern is similar? But the only difference is that this is a Weekly Chart. Target is Hit!!!
So, here we have a Simple Pullback Trading System explained within 2 minutes.