Today, I’m going to share with you How to use AIMS The Hunt – The Banana Indicator while day trading cfd markets.
This post shows a great profitable method you can use on any time frame or market.
However the focus on this post is on How to Day Trade CFD Markets. I trade the DAX30, US30 and NAS100 (US100) CFD markets everyday.
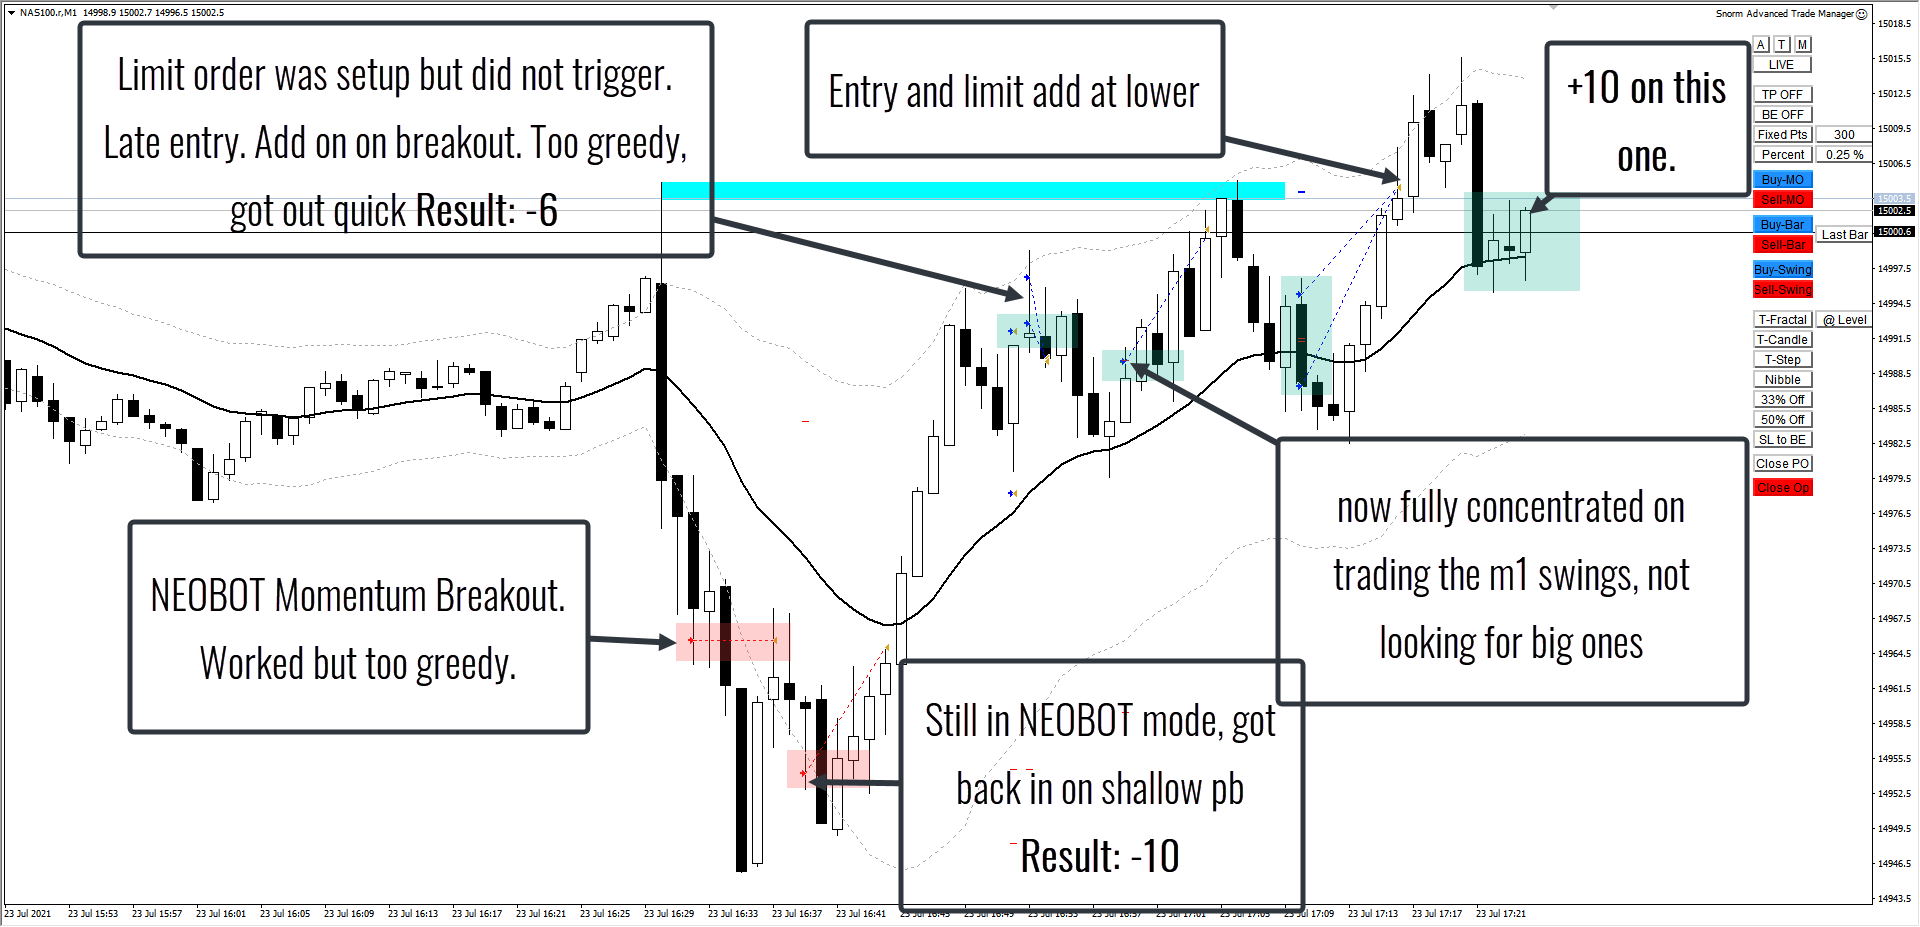
Here are some trades I took on the NASDAQ100 / US100 Today. I will share the trade in the form of two screenshots each marked with comments and analysis.
Please have a look and leave a comment below if you have a question.
Slide 1: Results of Today’s Trading

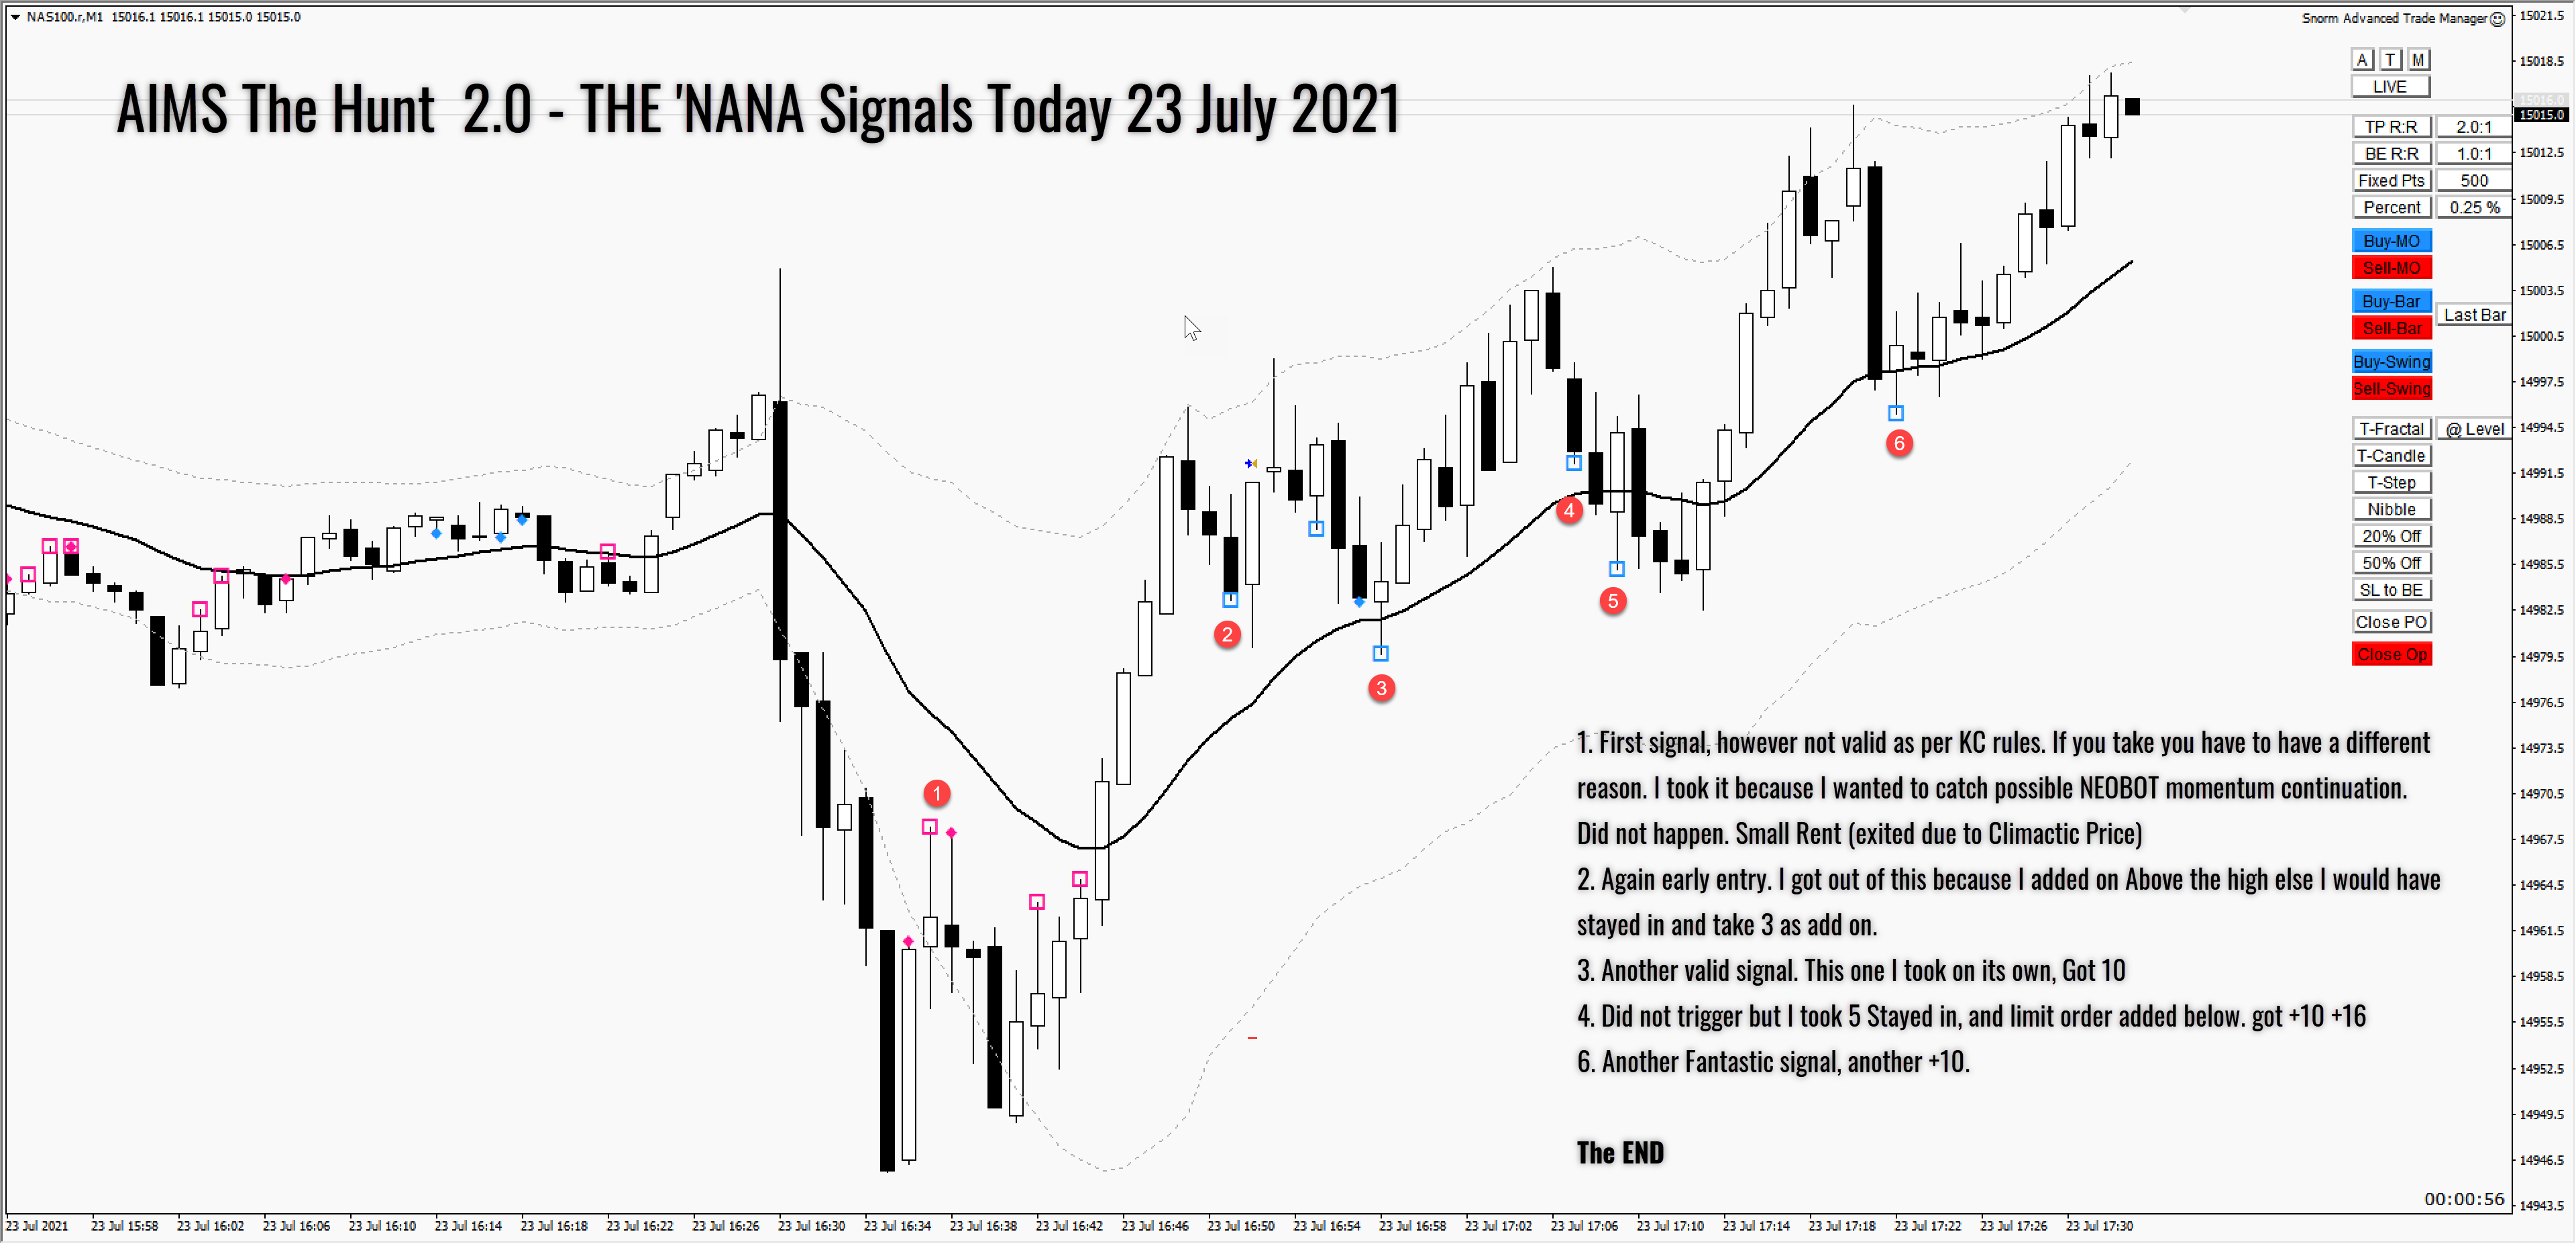
Slide 2 – AIMS The Hunt 2.0 – The Banana Signals
If you’re a beginner or new to the method, it might seem a bit daunting to trade the empty chart. Don’t worry though, we have coded some indicators that will help you spot the correct entry points using this method.
AIMS The Hunt 2.0 has 3 entry signals. The Seed, The Cherry and The Banana. On the chart below you will see, The Seed and the Banana Signals. The banana signals are marked with a square symbol while The Seed signals are red and blue dots.
6 signals within 1 Hour of Trading
- First signal, however not valid as per KC rules. If you take you have to have a different reason. I took it because I wanted to catch possible NEOBOT momentum continuation. Did not happen. Small Rent (exited due to Climactic Price)
- Again early entry. I got out of this because I added on Above the high else I would have stayed in and take 3 as add on.
- Another valid signal. This one I took on its own, Got 10
- Did not trigger …
- I took 5 Stayed in, and limit order added below. got +10 +16
- Another Fantastic signal, another +10.
ps: perhaps the Number 6 was the one to be allowed to let run because now price has broken into a trend out of the range.

Slide 3: US30 Late in the day (Mid Day US)


